Sum
2017 leader NDX / QQQ has stopped on significant long term resistance, YR2 & 1HR3. But trends remain strongly up (rising MAs across the board) and no RSI divergence on daily or weekly charts.
SPX set saw selling from YR1 / 1HR2 area and broke MayPs, but managed to recover MayP on Friday. As long as MayPs holds, bulls get benefit of doubt.
This was also the case for NYA & VTI - although they didn't reach long term pivot resistance, Q2P test on NYA held and both back above all pivots on Friday.
INDU / DIA is a bit weaker with more glaring RSI divergence, and testing MayP - not conclusively above.
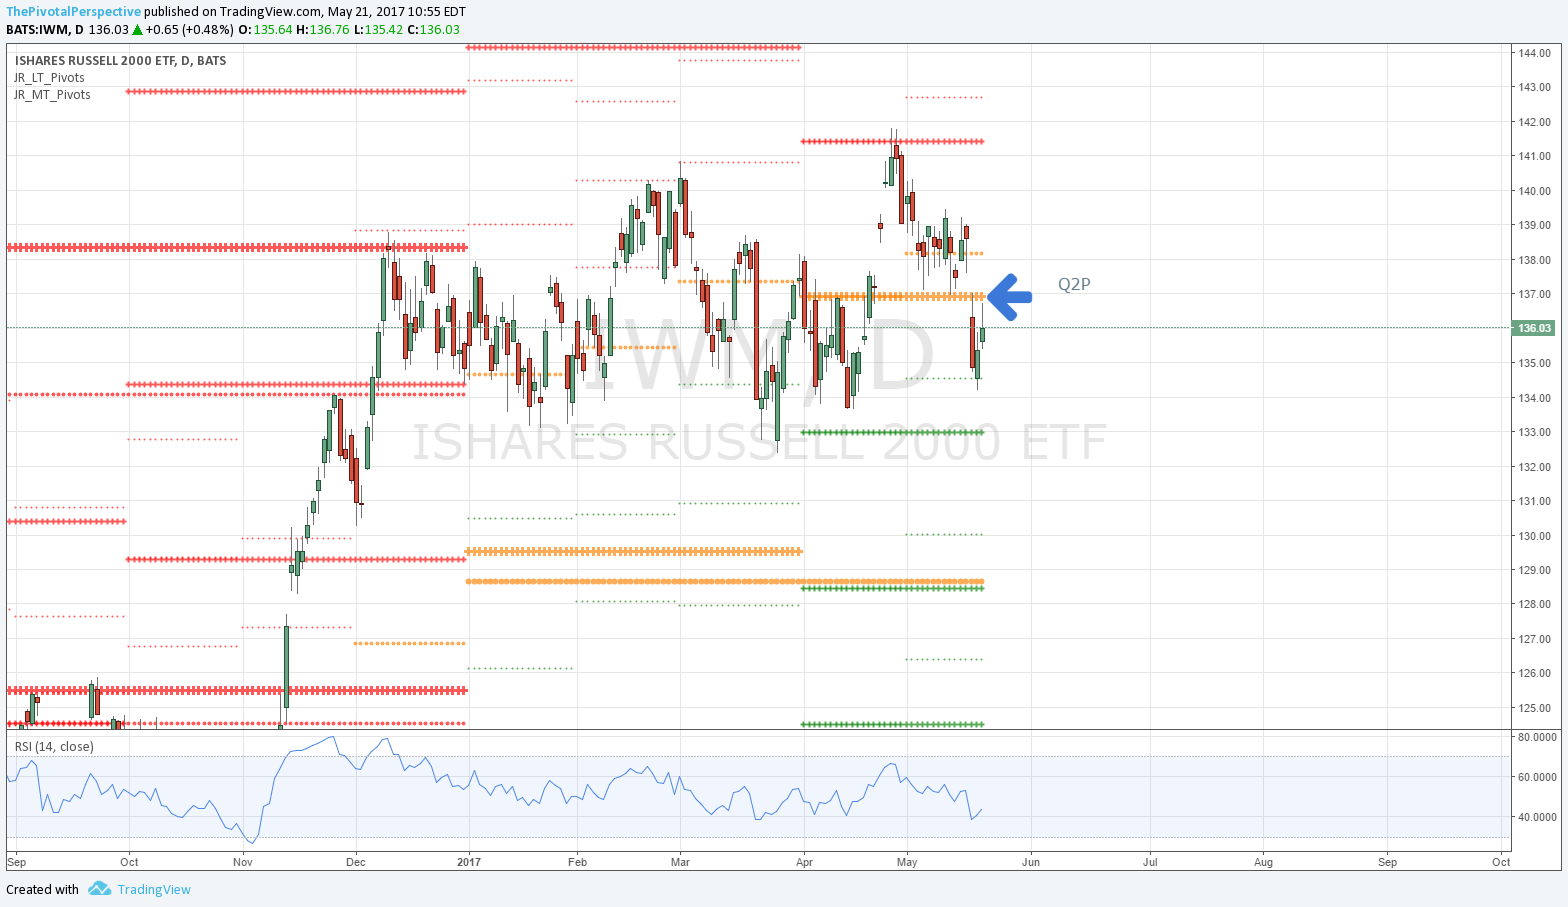
RUT / IWM, the weakest of the 5 for much of this year, remains below Q2P.
My take - as long as SPY and VTI are above MayPs, bulls get benefit of doubt and IWM may recover Q2P again with NDX / QQQ resuming up. But if those break for the 2nd time this month, I expect that to be definitive and IWM will continue to lead main indexes lower.
Charts
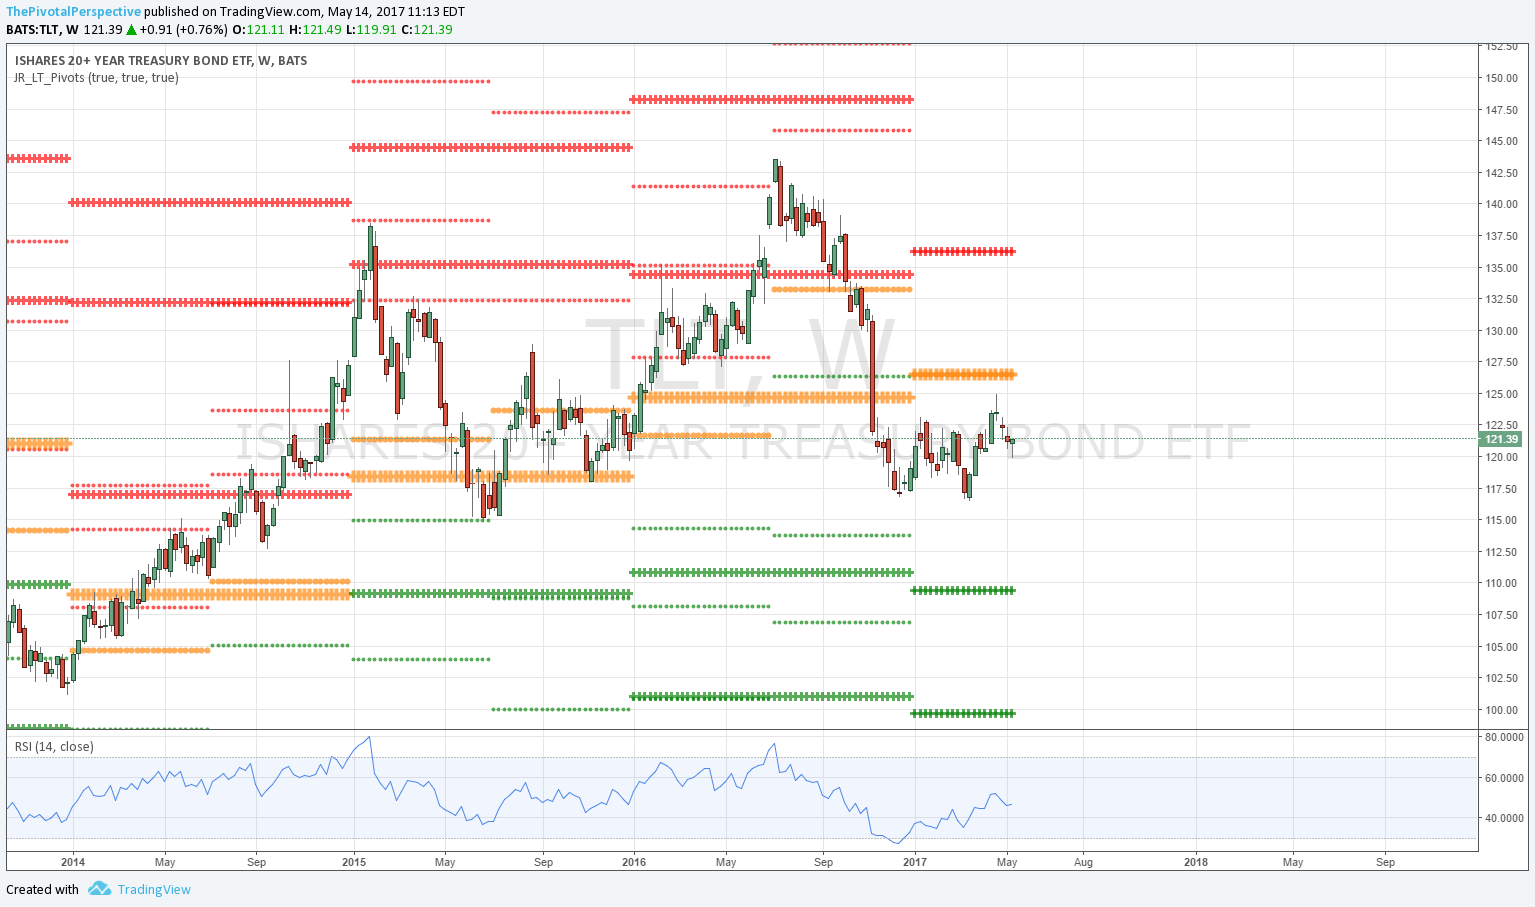
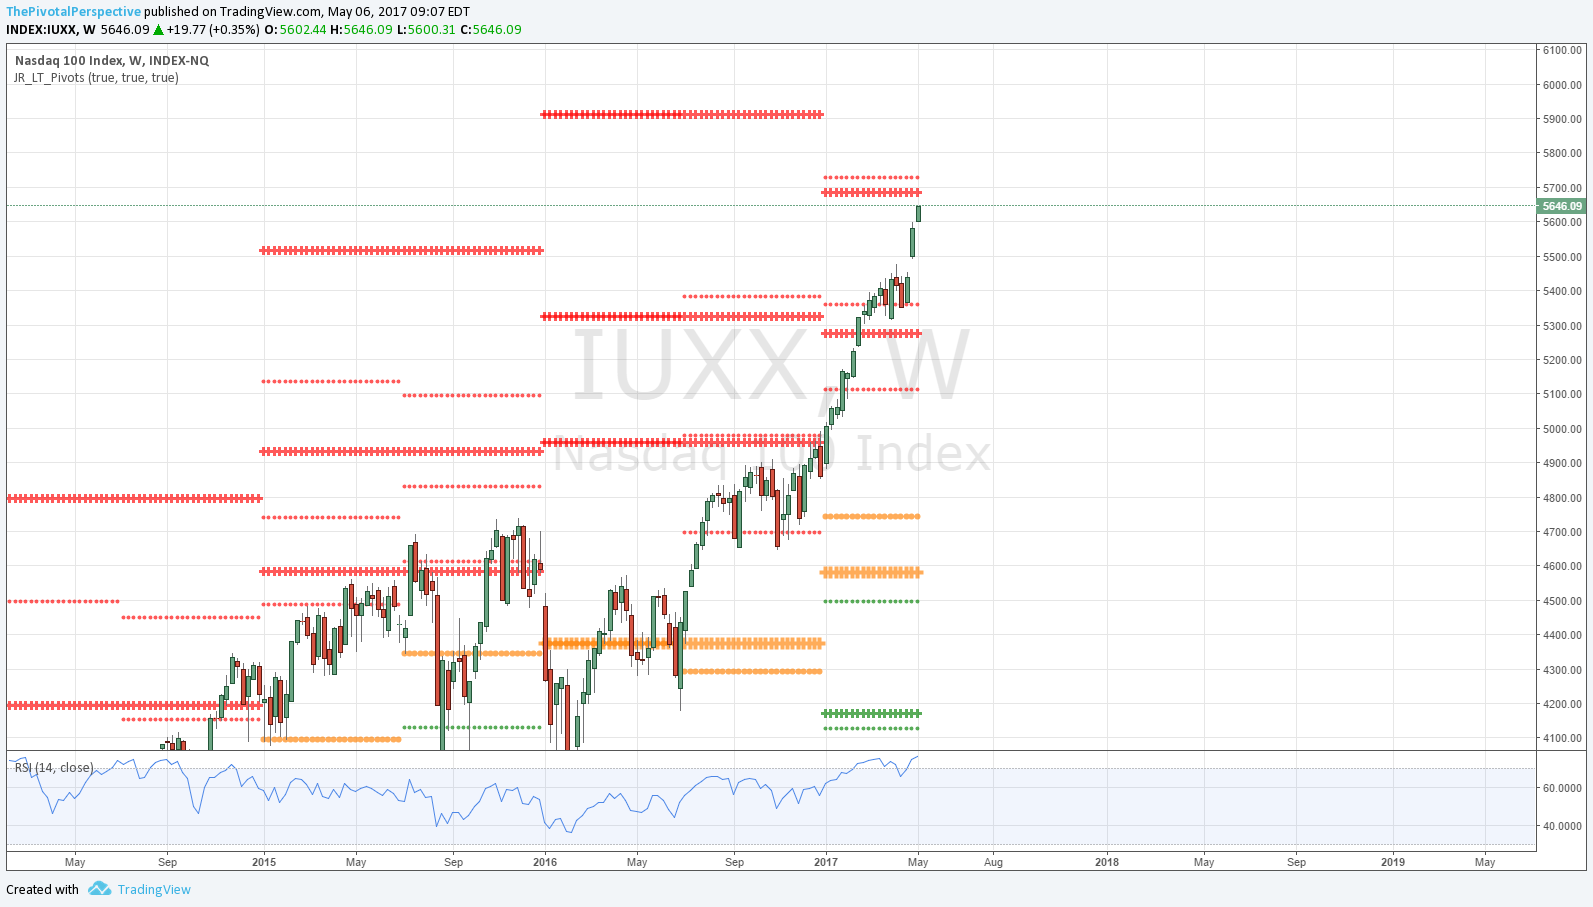
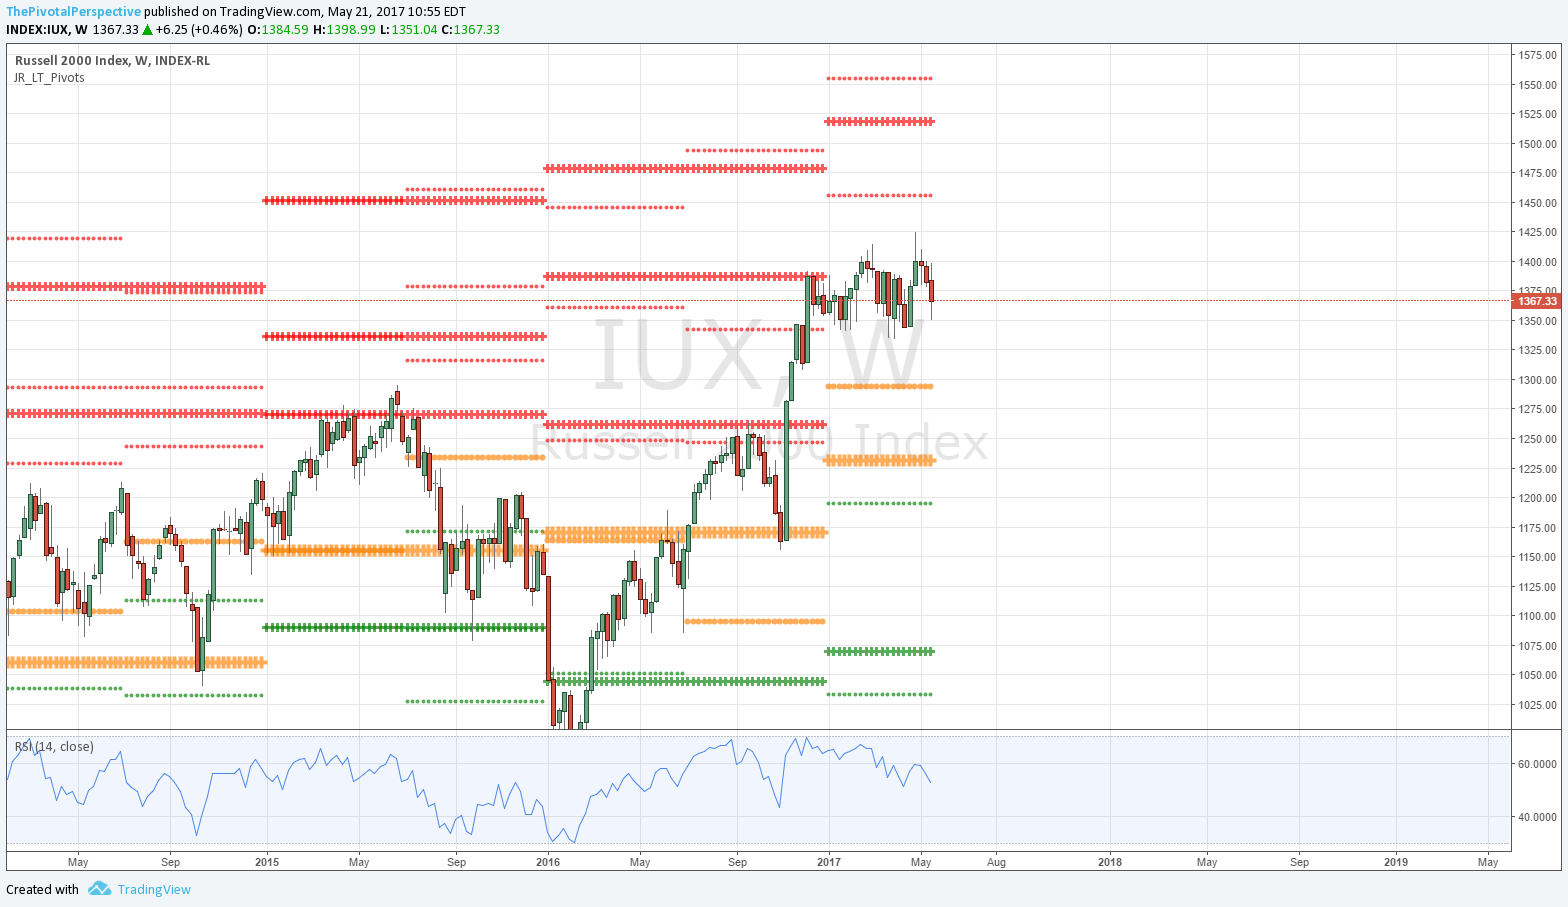
Cash index weekly charts with long term levels only
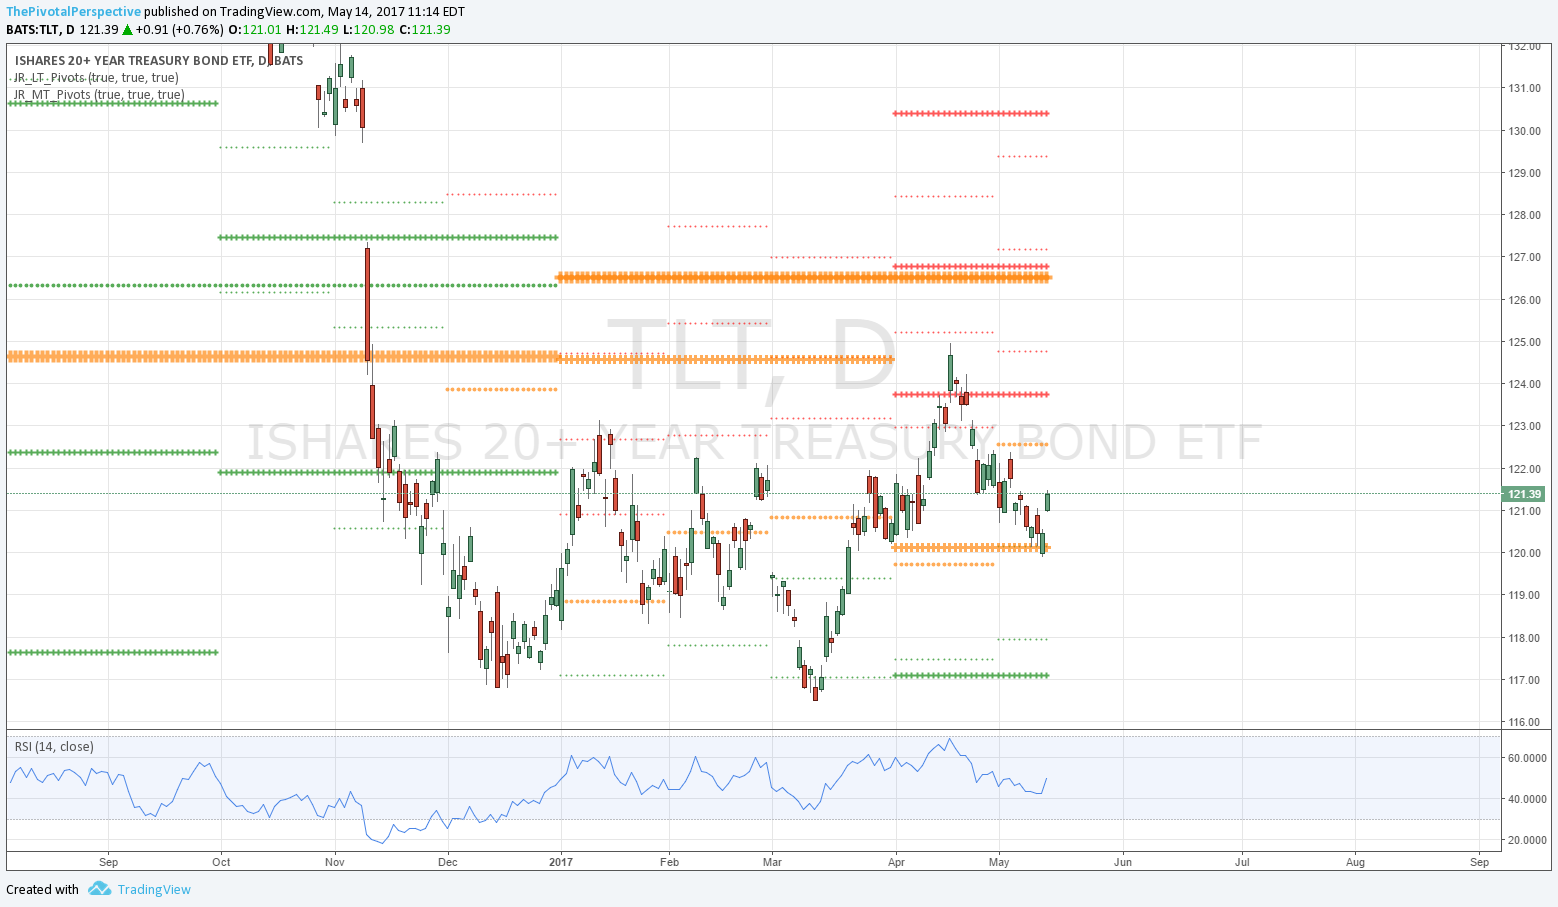
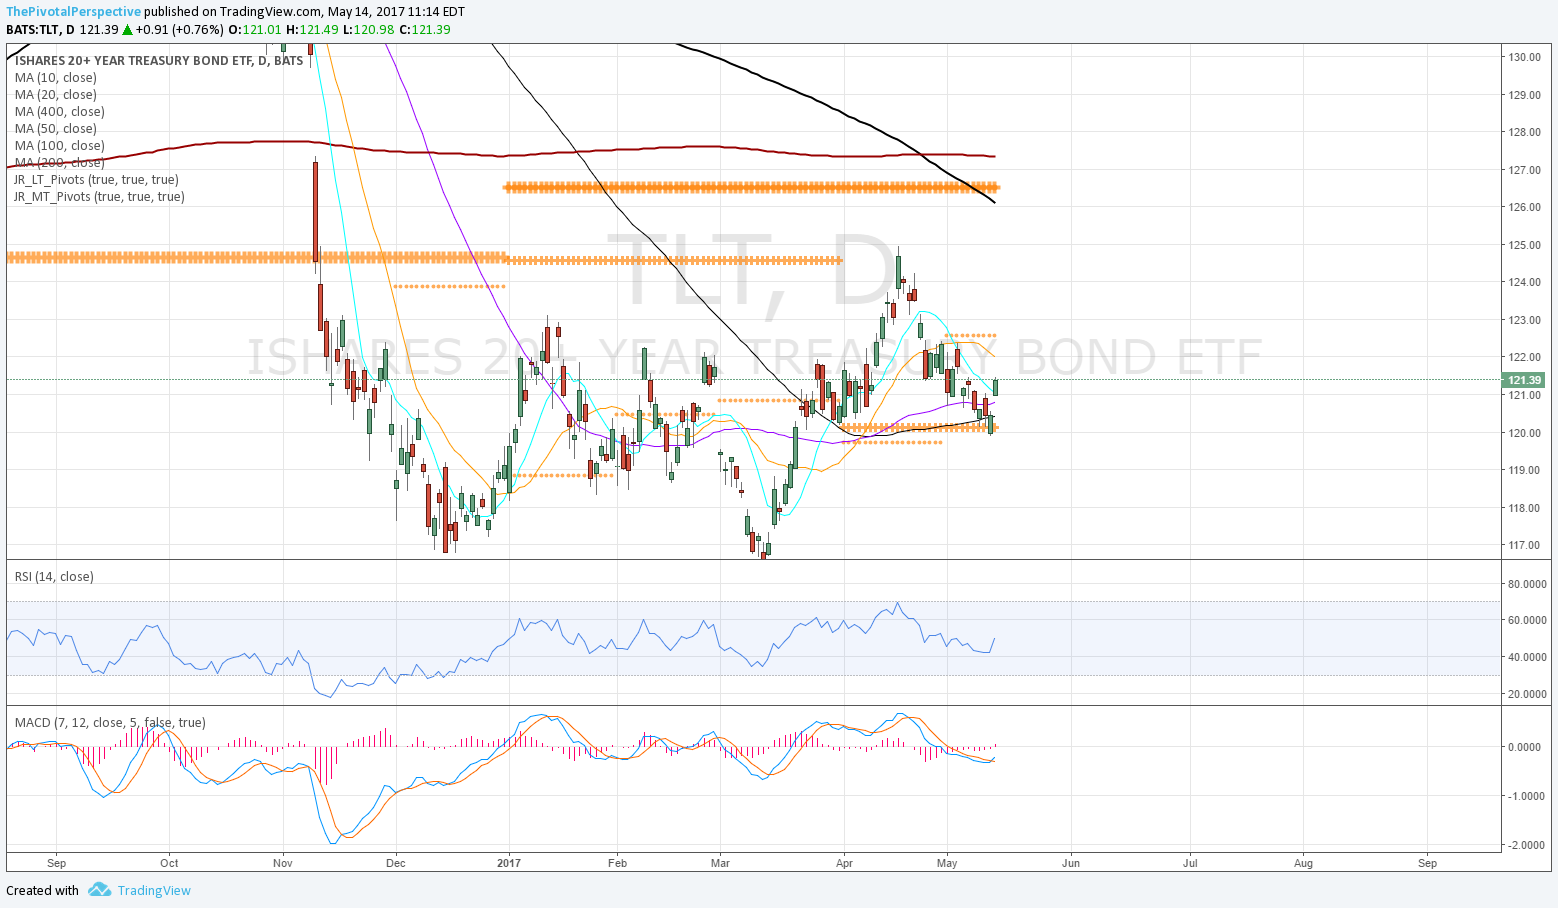
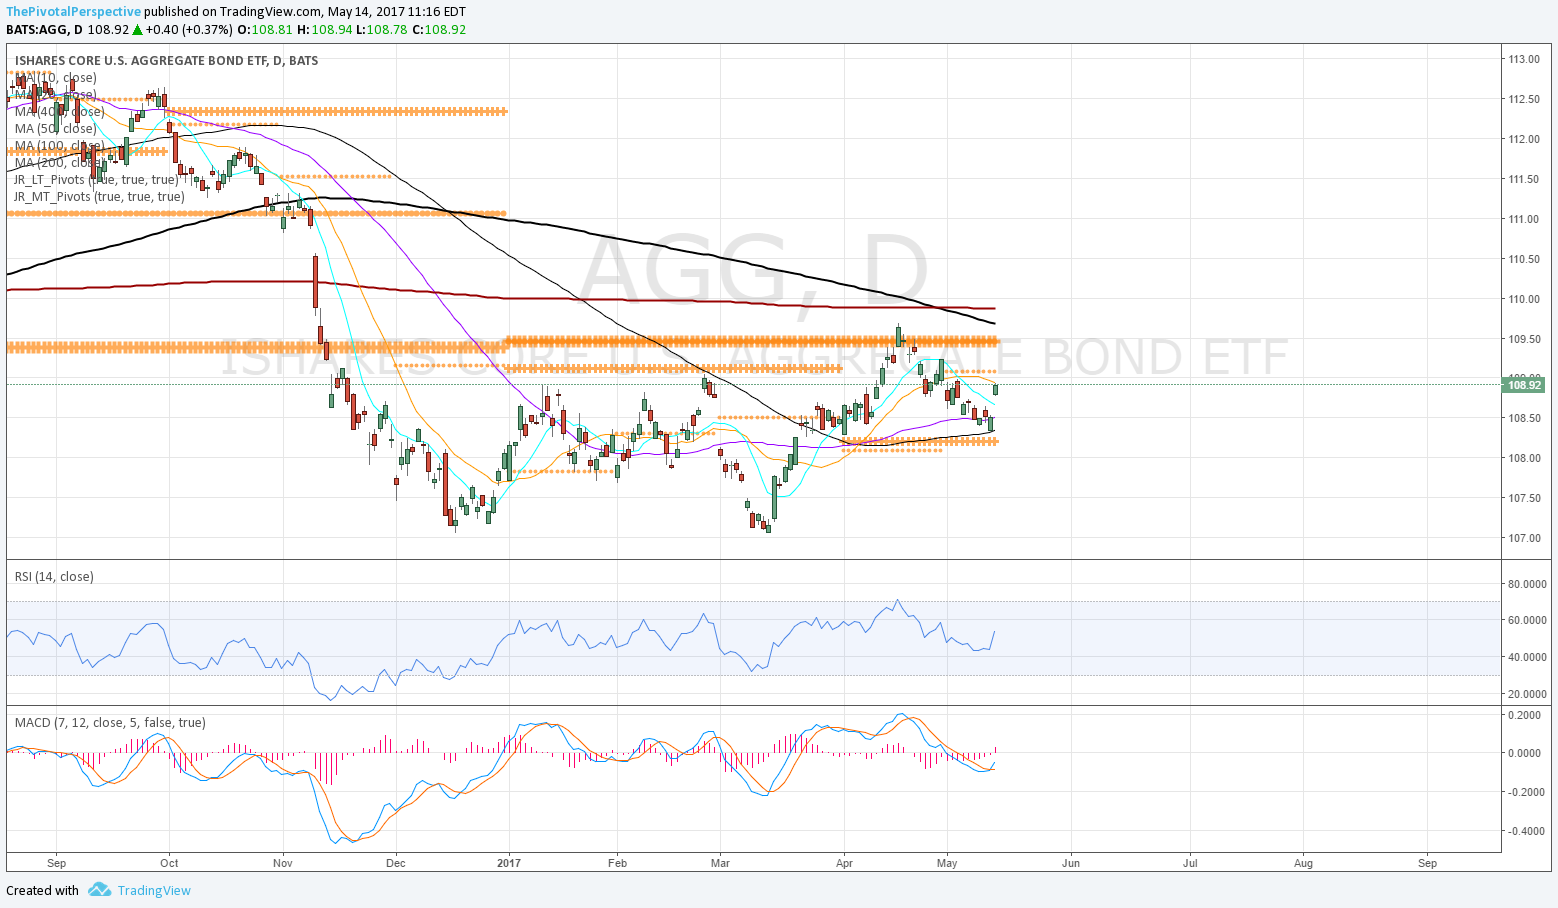
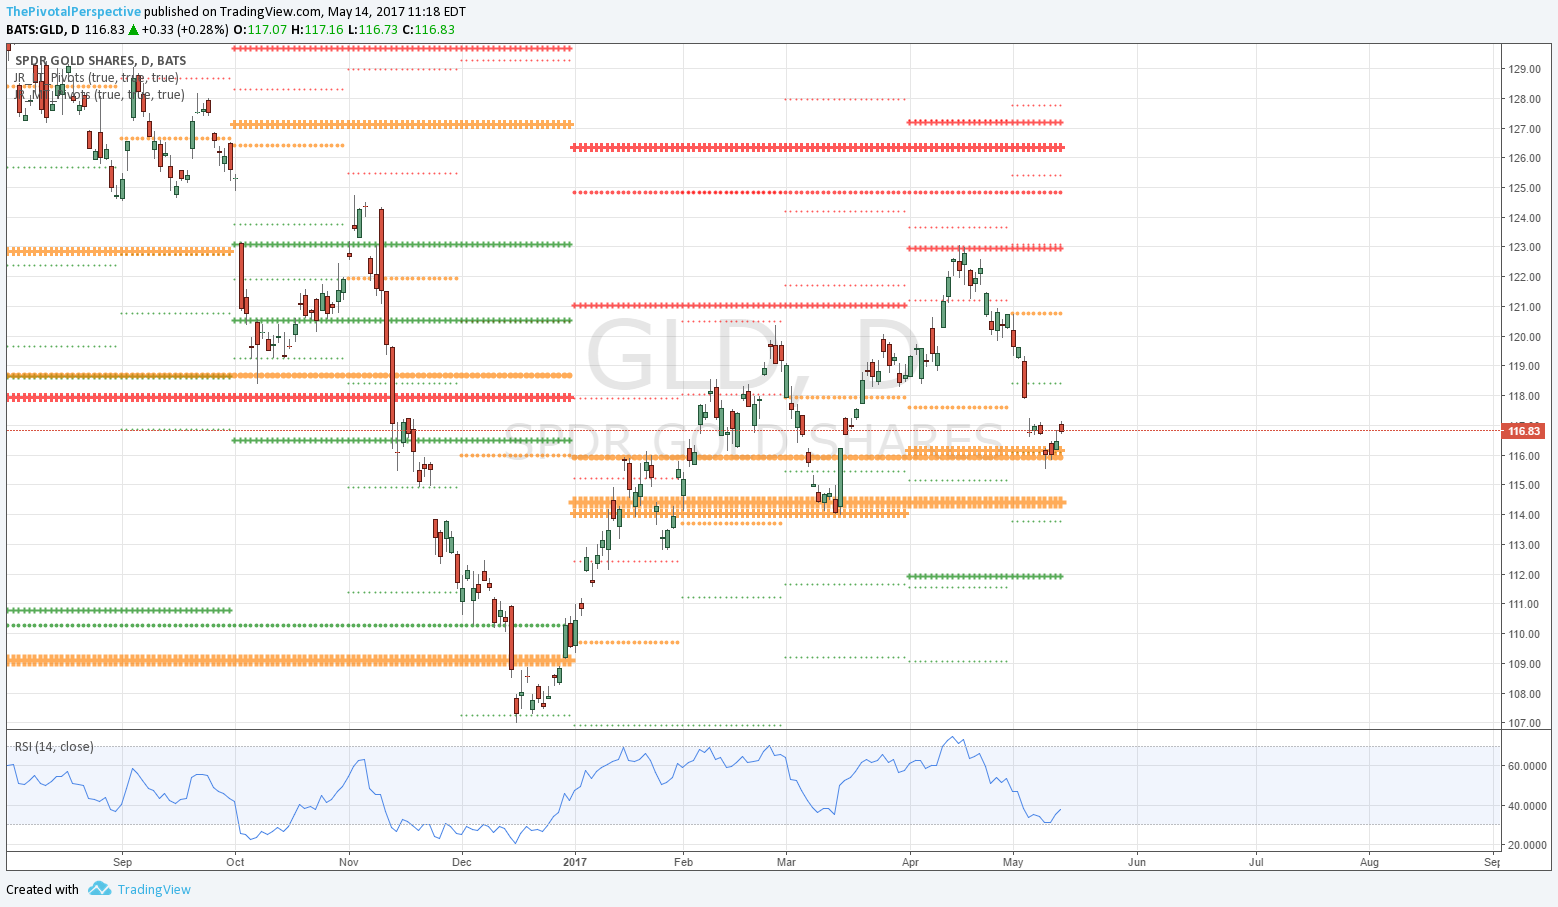
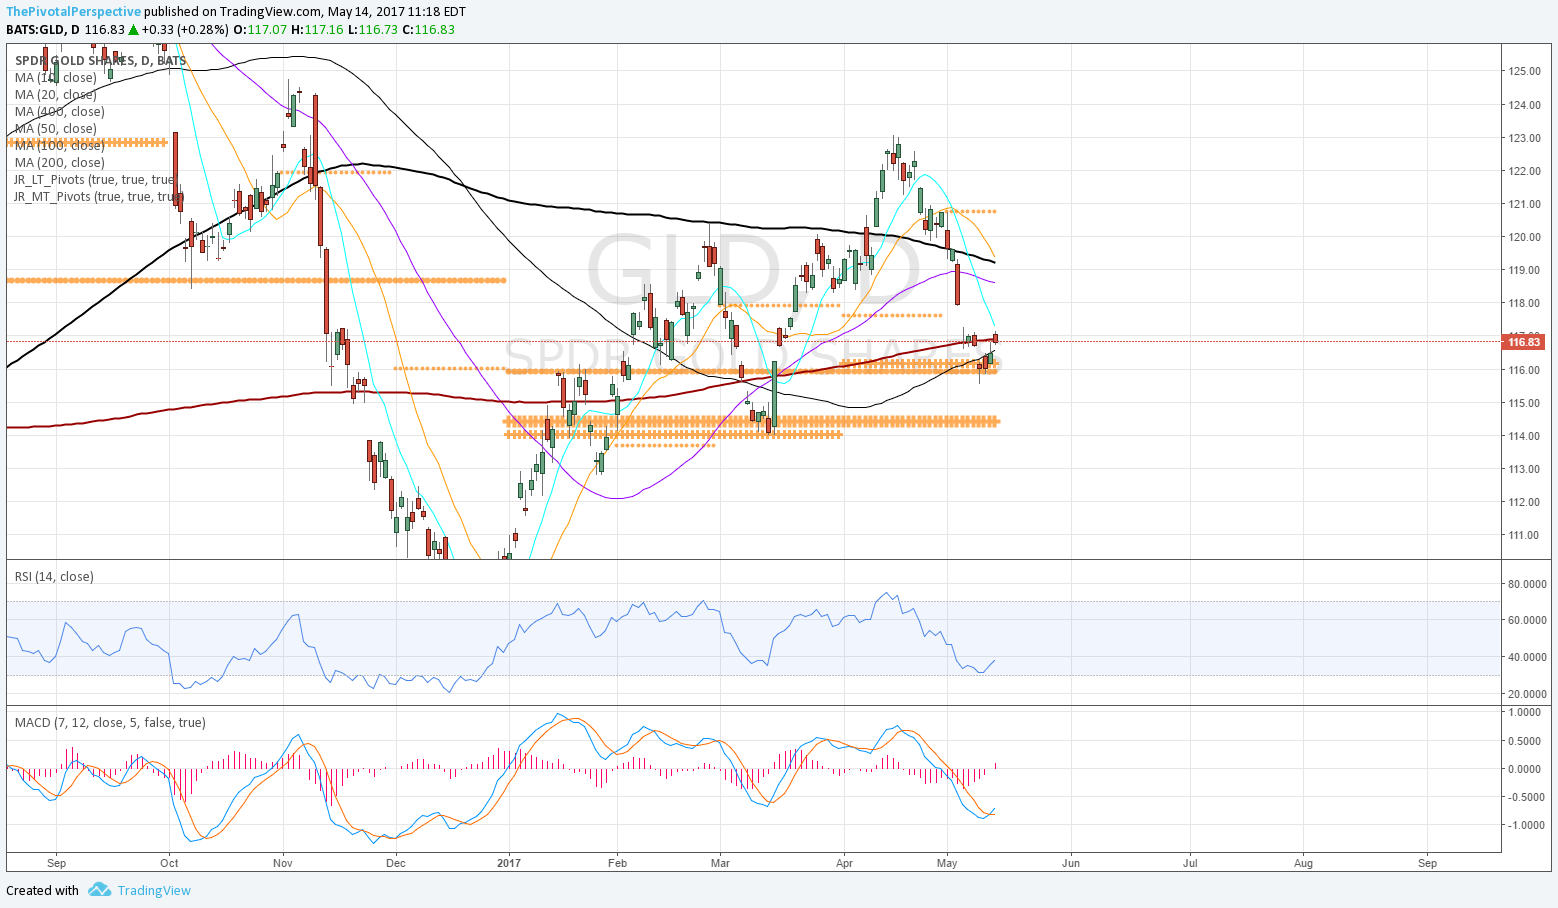
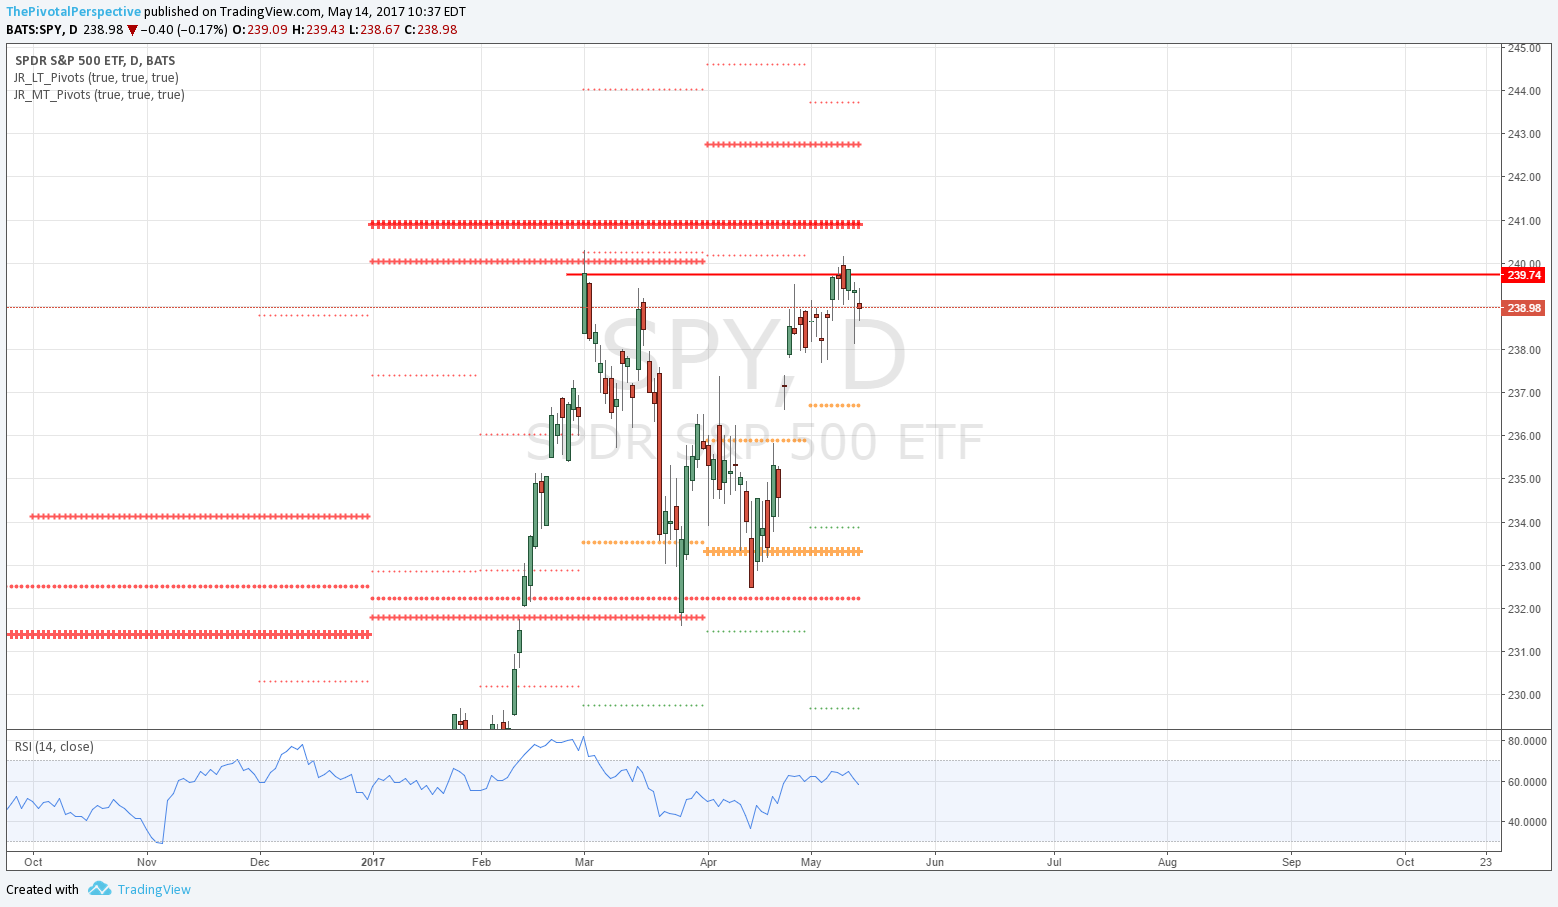
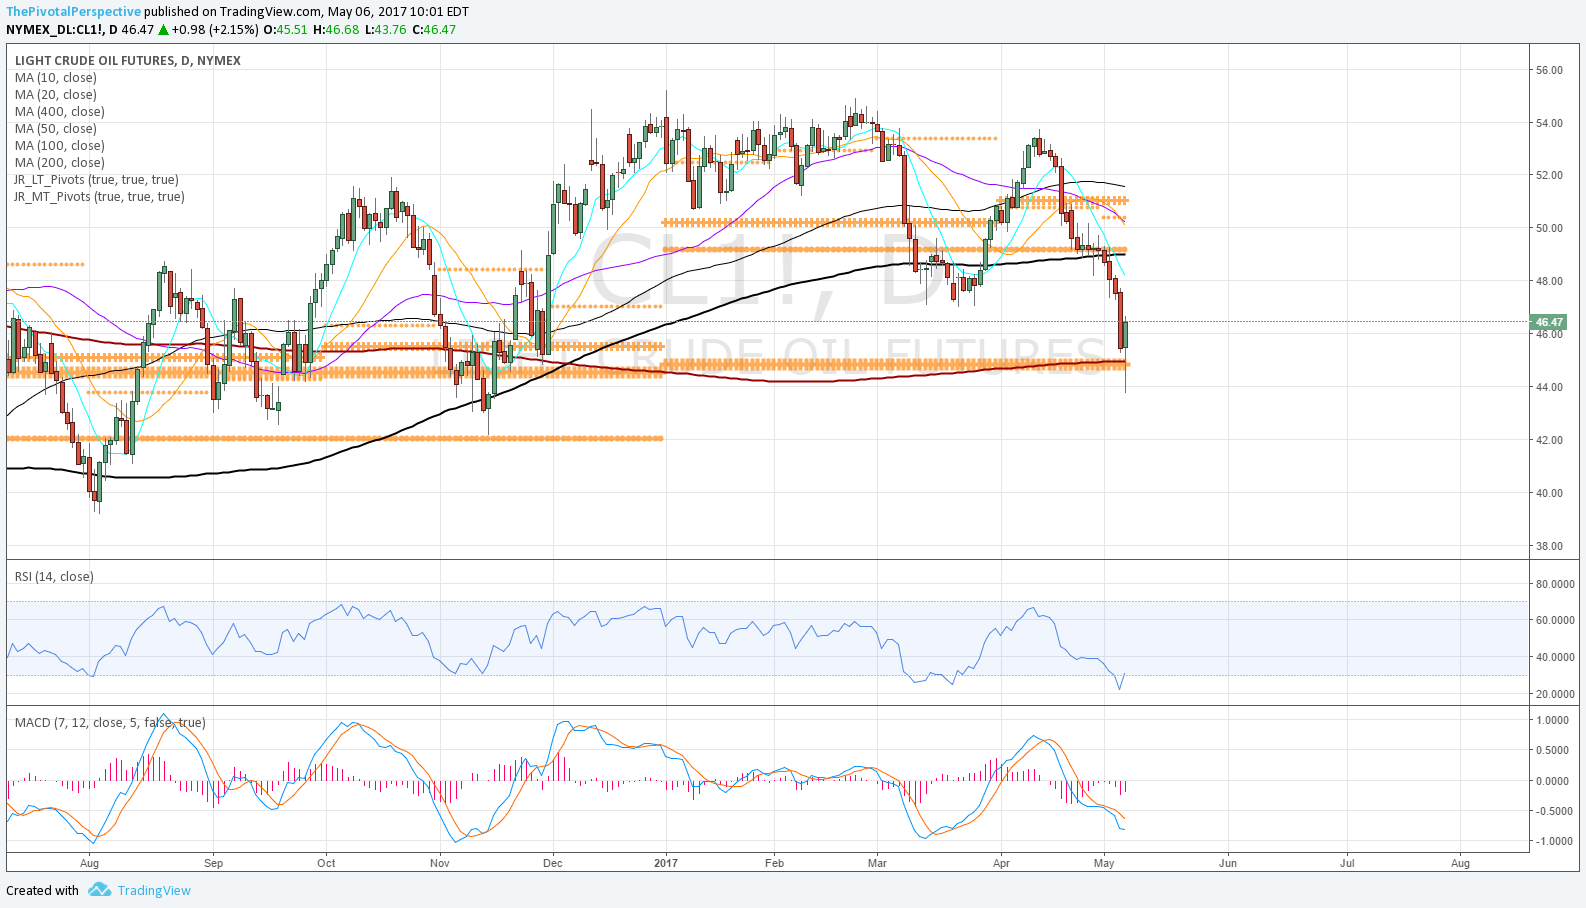
Daily ETF chart with long term & medium term pivots
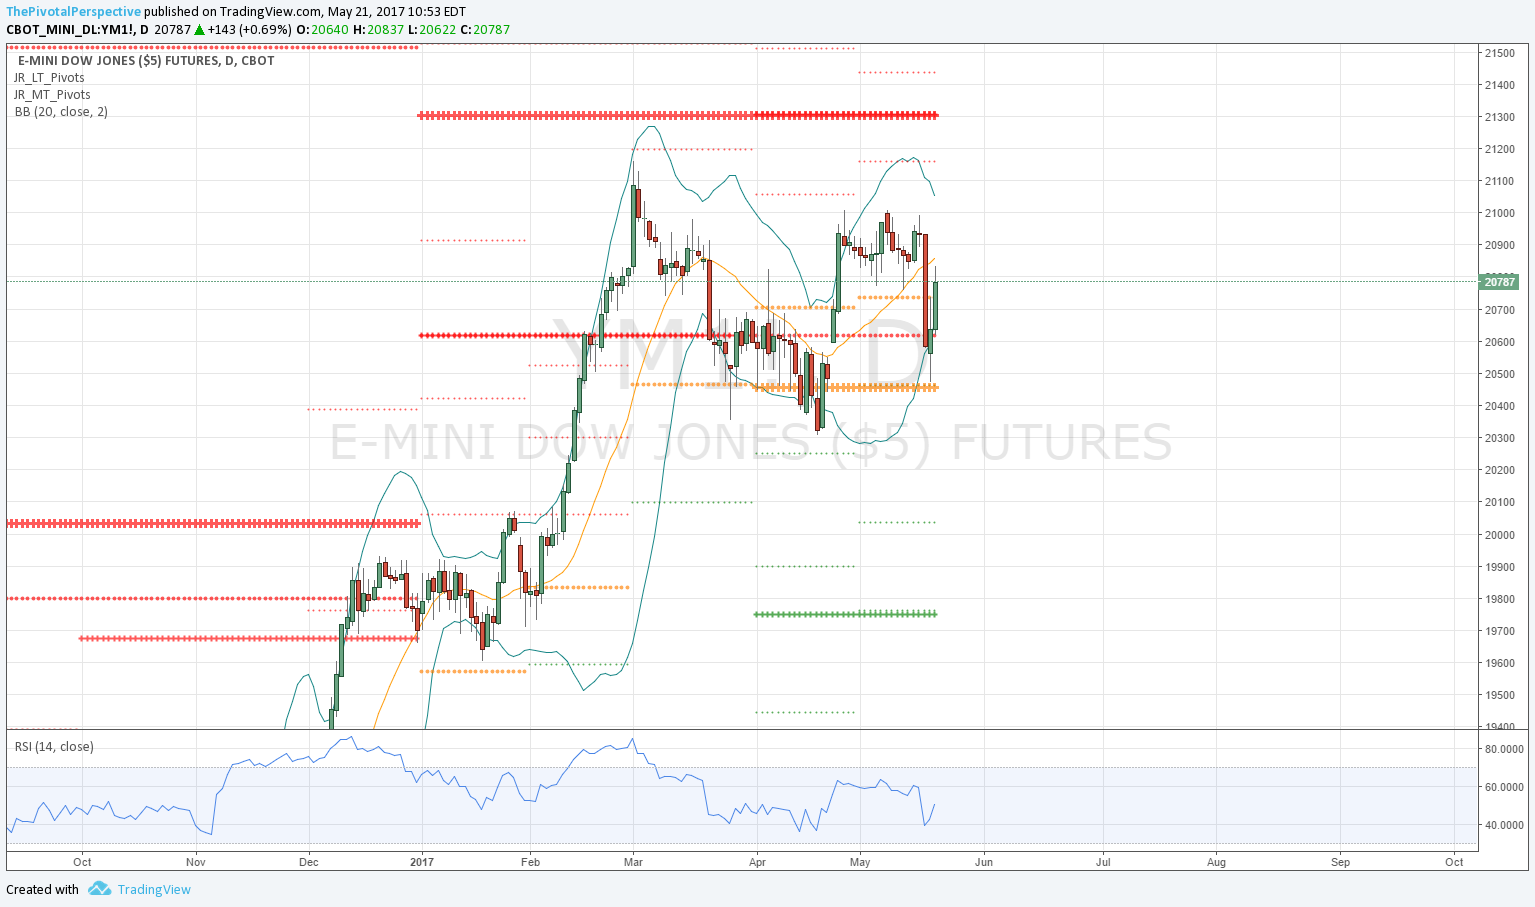
Futures current contract pivots only (no S/R) and MAs for clarity of entries (now June 17 M)
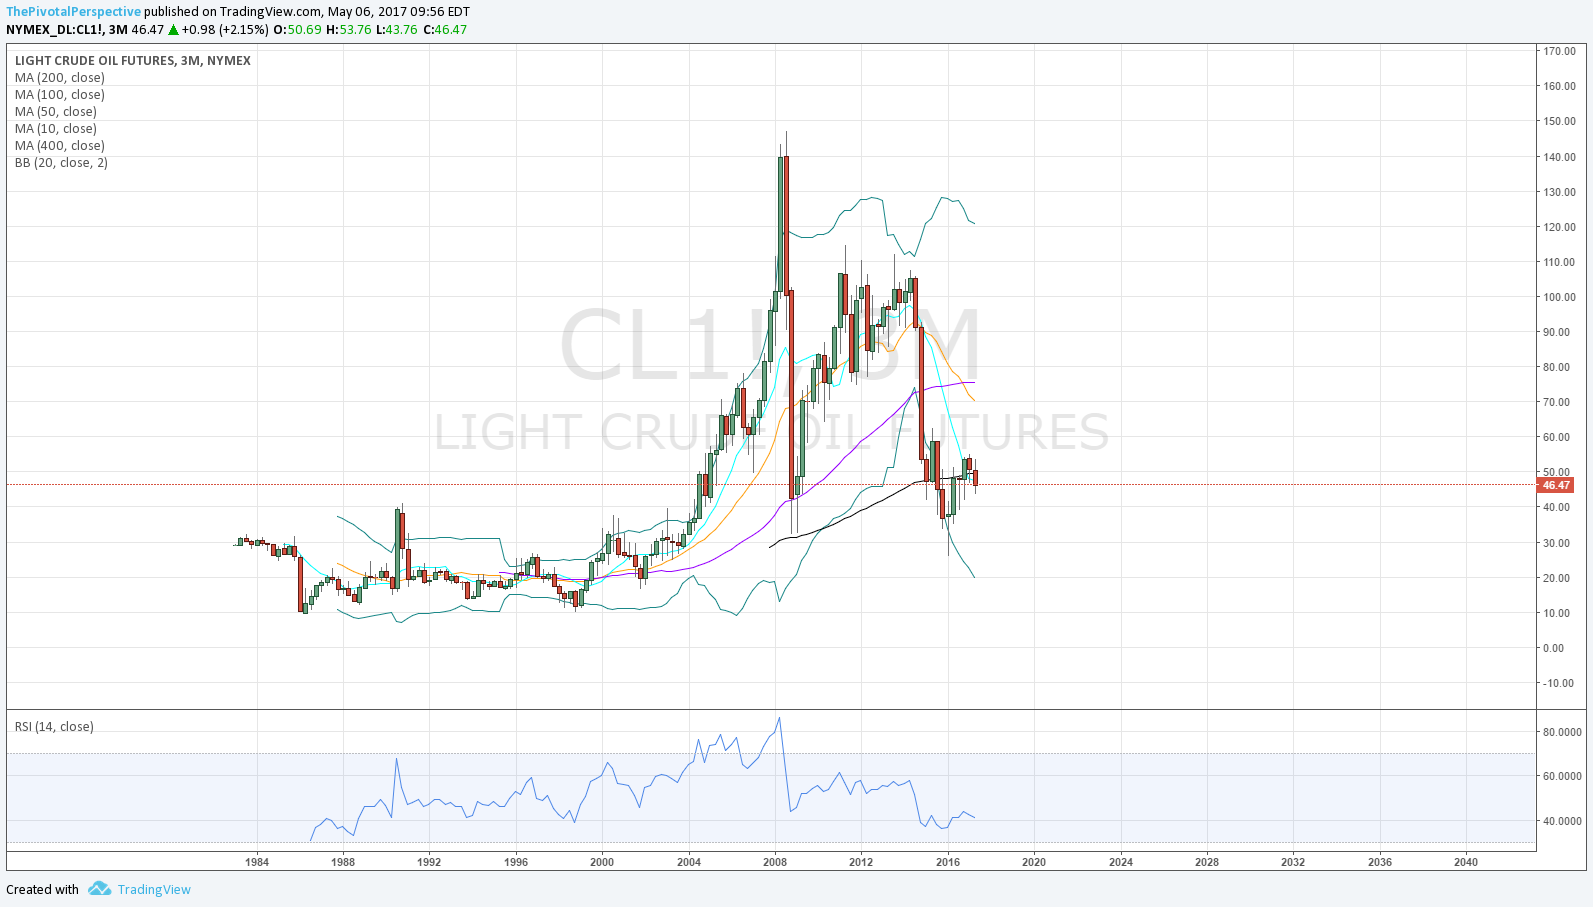
Futures "1" continuous contract with Bollinger bands
SPX / SPY / ESM / ES1
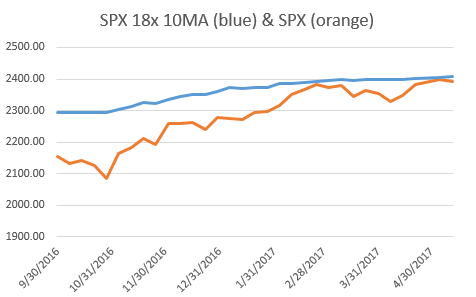
SPX W deserves careful attention with double top on YR1 / 1HR2 area. This could be as important as double bottoms on 2HS2 in 2015 and YS1 / 1HS1 in 2016. However, last candle also gives chance for comeback, with hold of 10MA and rising 20MA (MAs not shown).
SPY D shows another fake break which is a bit annoying if you take action on it (4/13 break of Q2P followed by immediate recovery, and 5/17 followed by recovery in 2 days).
ESM shows resistance at the 3/1 highs, with only 2 slight closes above. 50MA rolling over to flat slope.
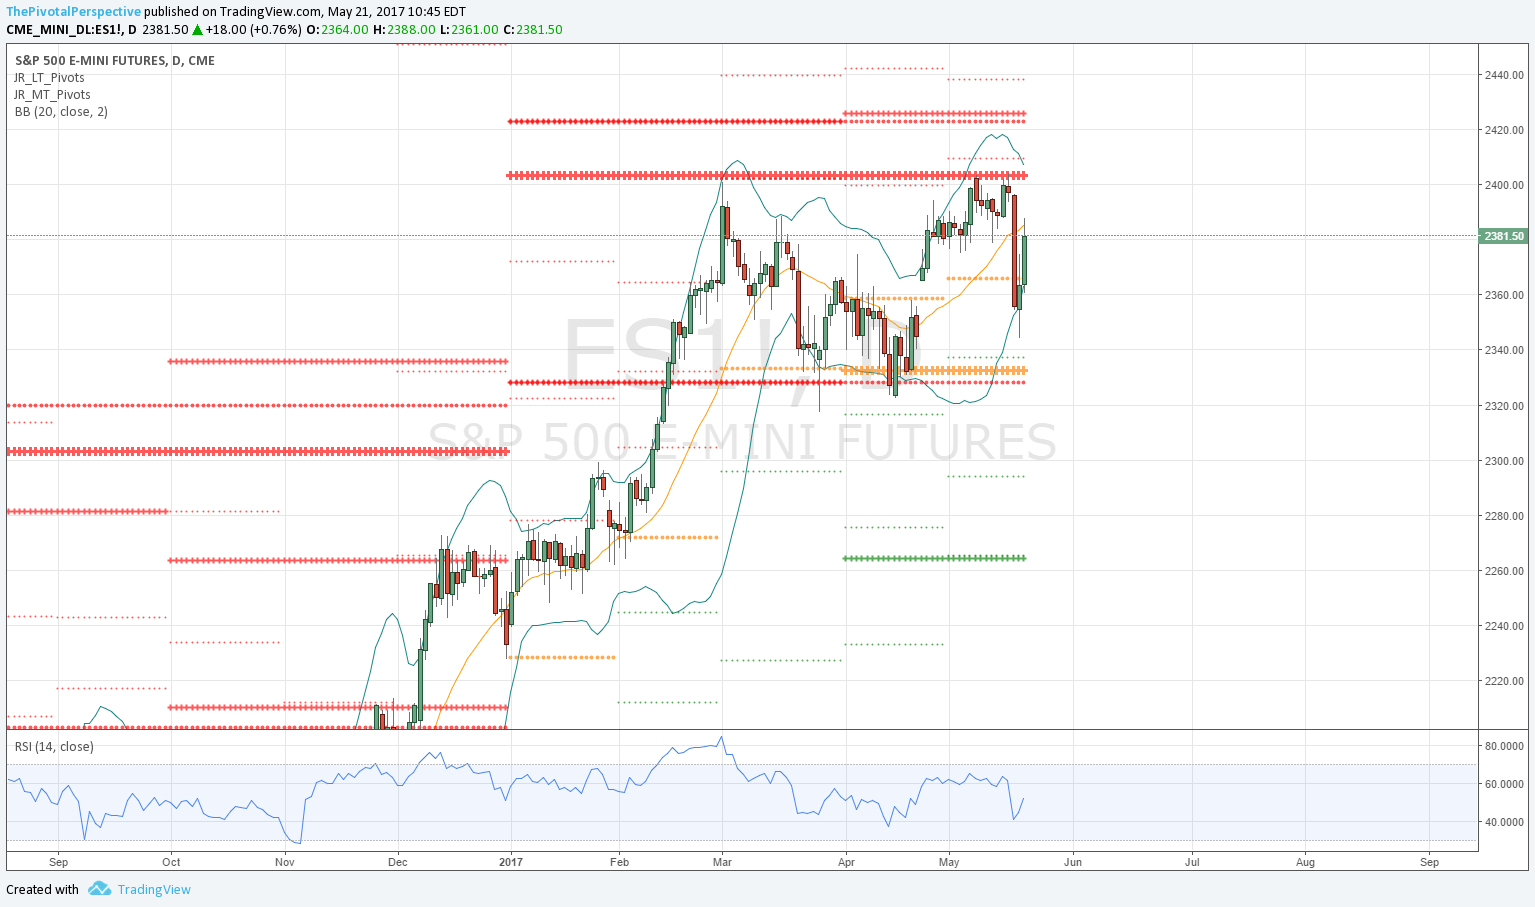
ES1 visit to lower daily BB especially with rising slope was bought.
SPX set sum - YR1 / 1HR2 stopping the rally twice is potentially bearish, but as long as index is back above all pivots bulls get benefit of doubt on a comeback.


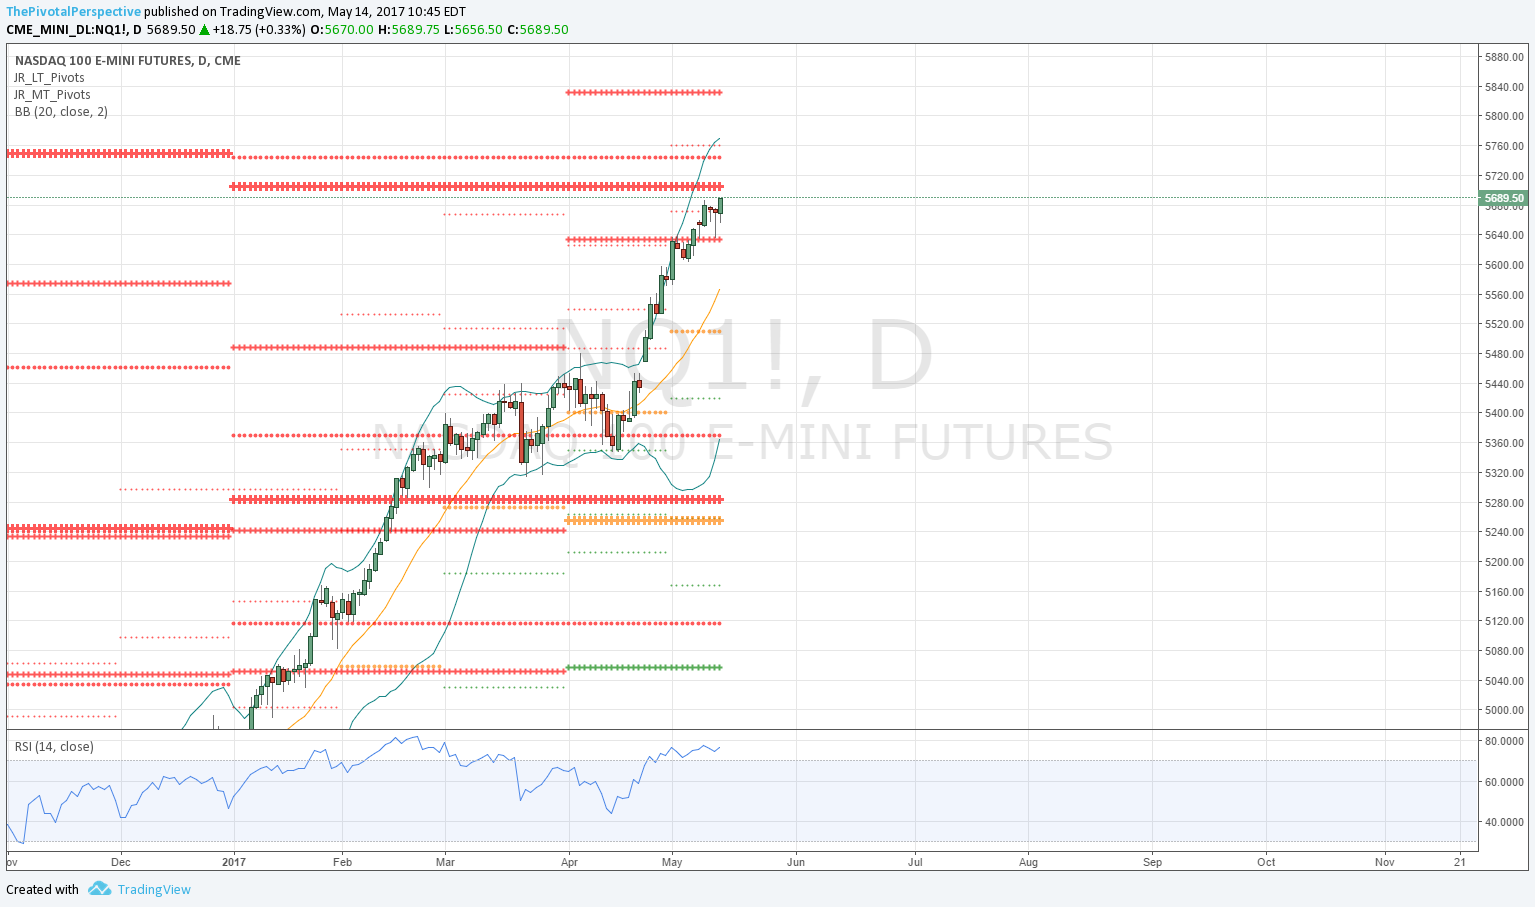
NDX / QQQ / NQM / NQ1
NDX W chart shows selling at YR2 and 1HR3.
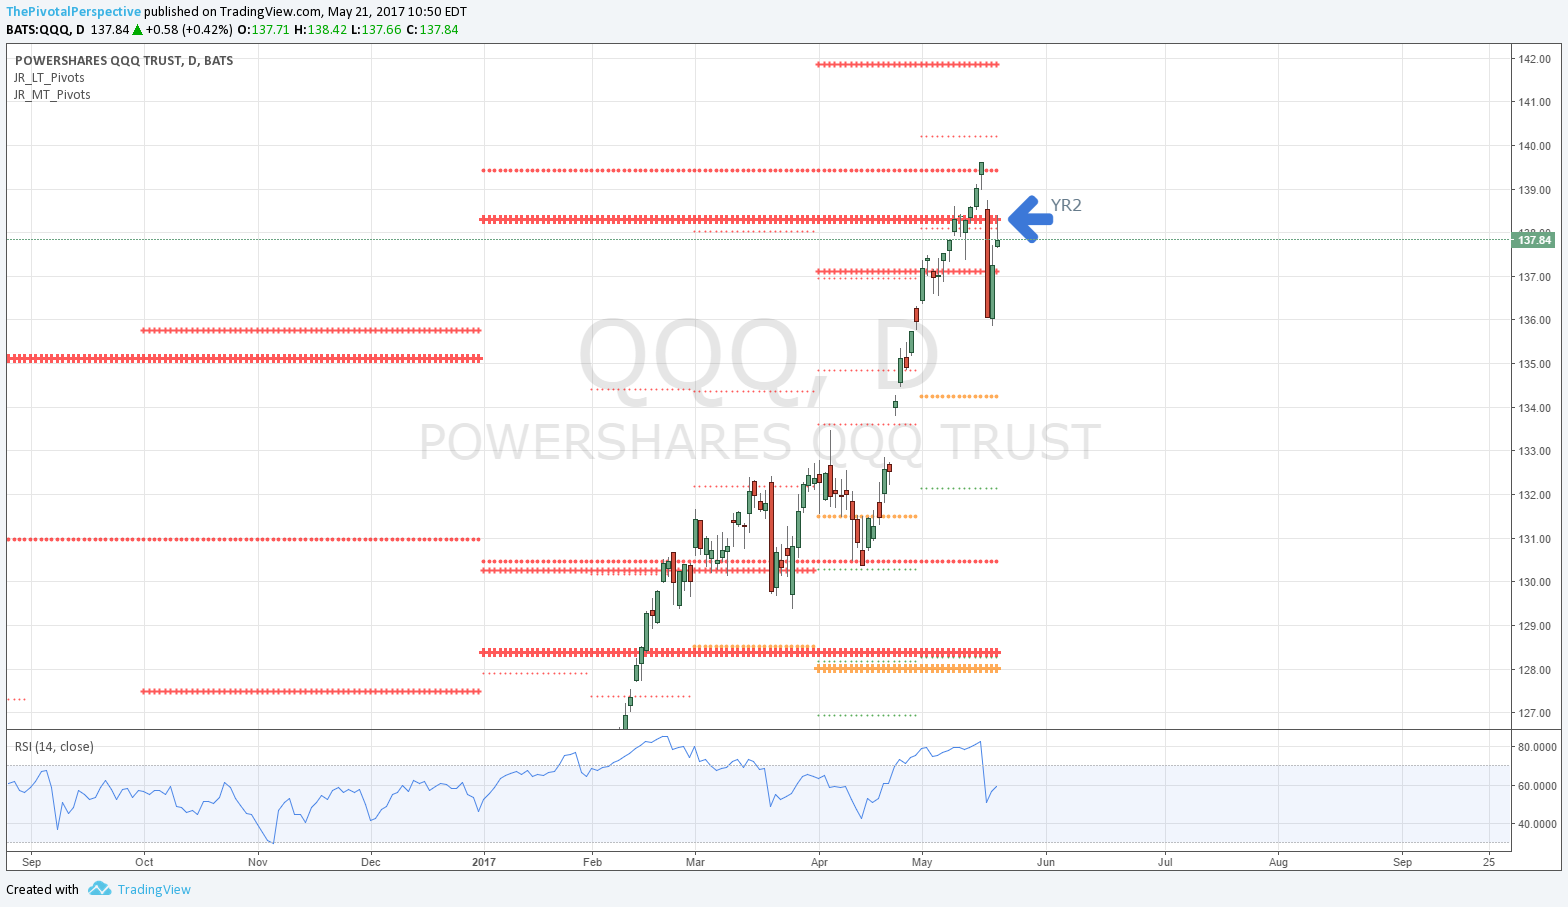
QQQ on Friday still had resistance at YR2.
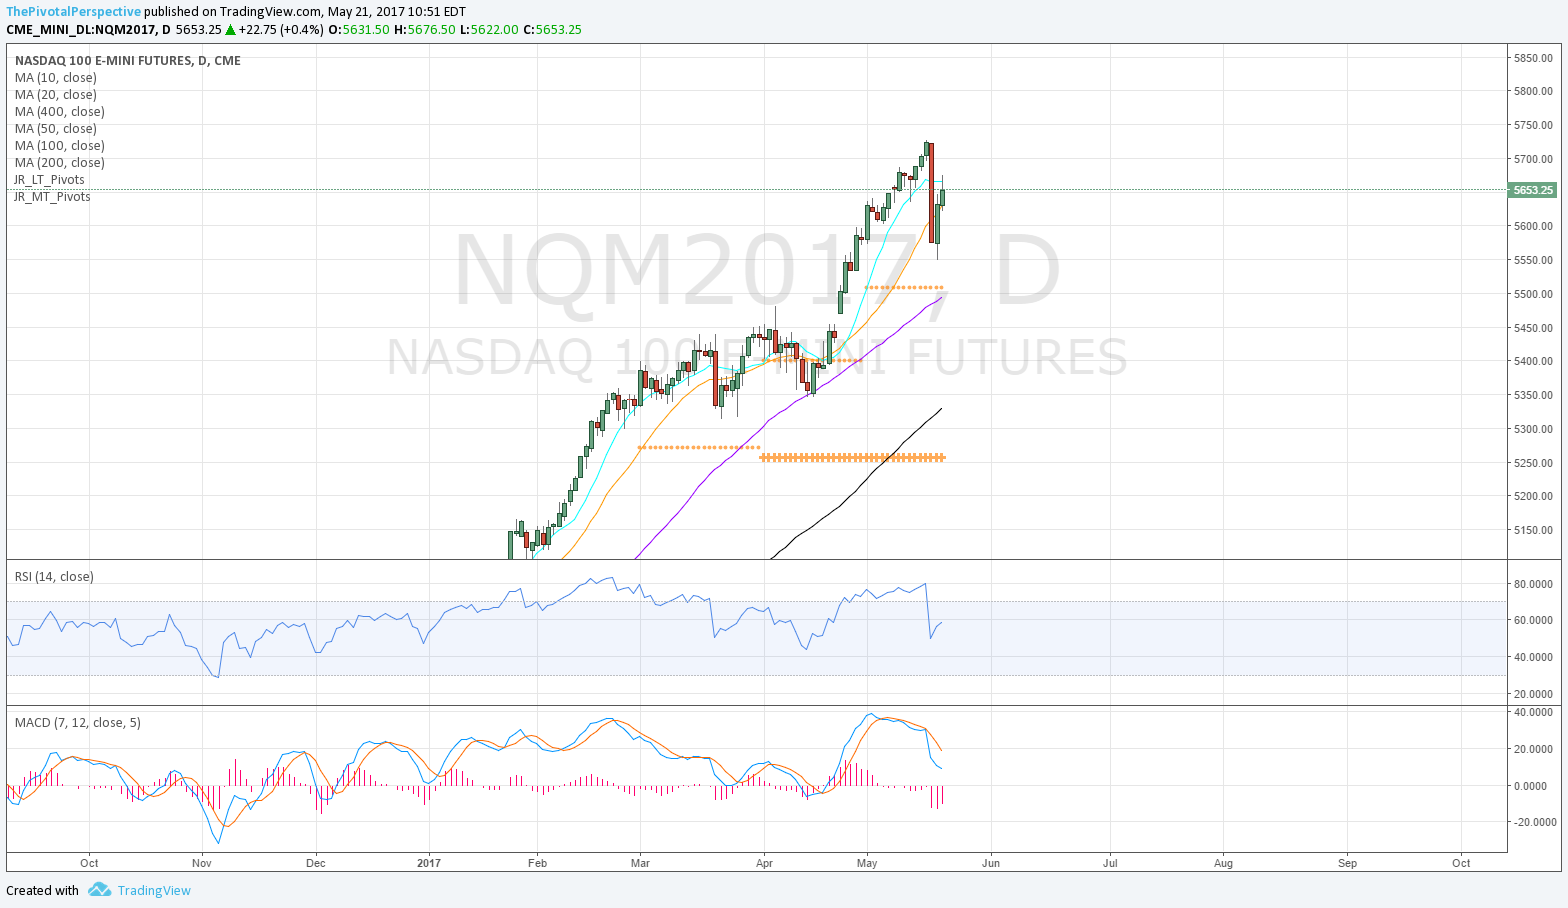
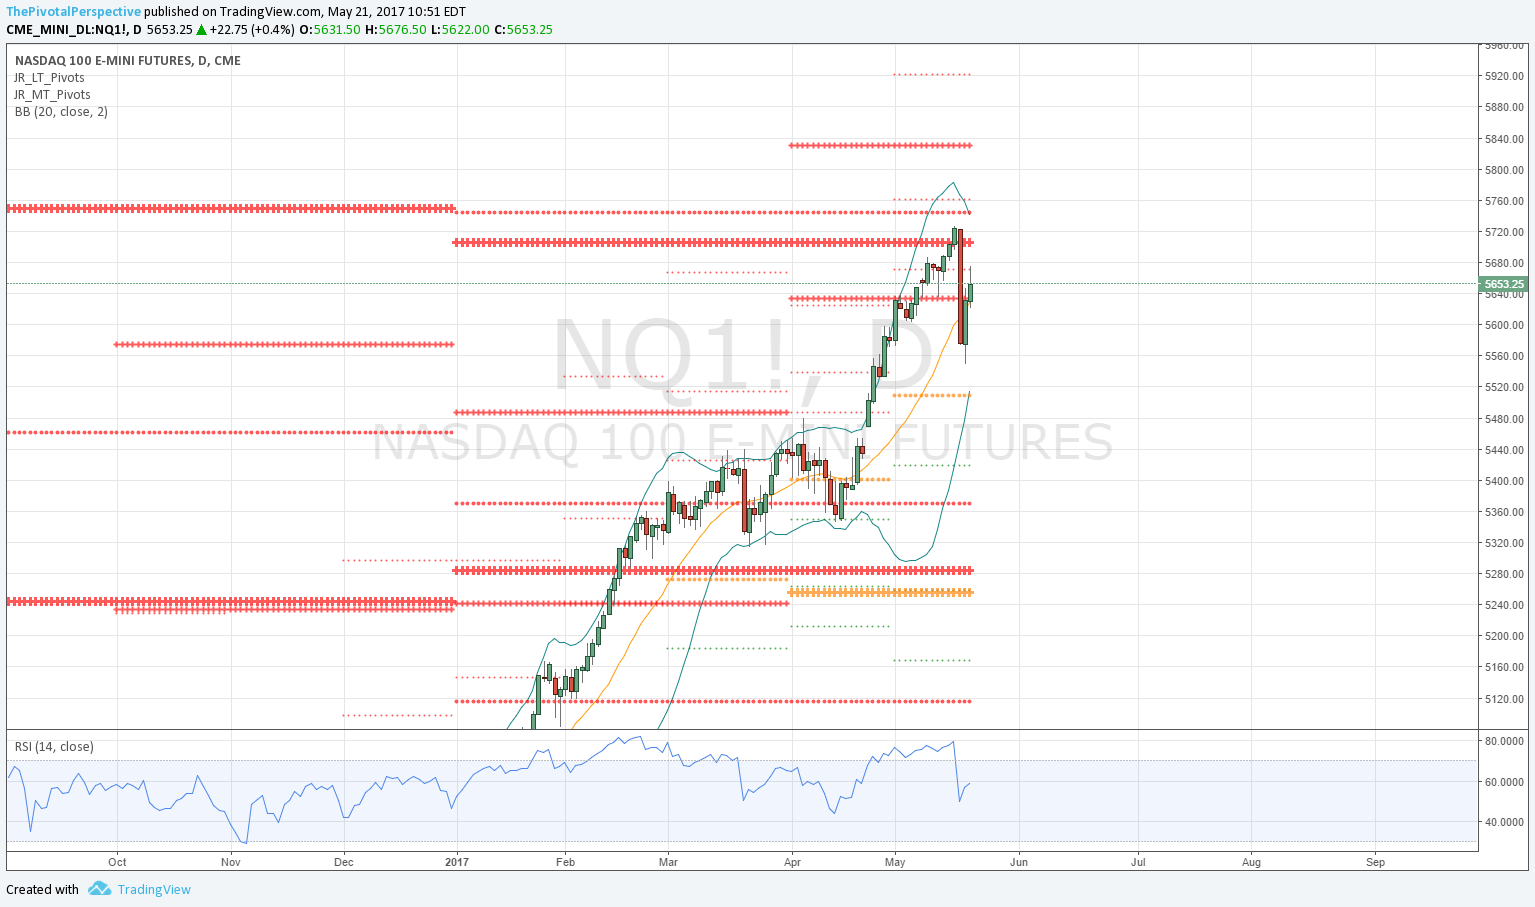
Futures charts still nicely rising MAs and well above all pivots.
NDX set sum - strong trends, but selling at significant resistance of YR2 / 1HR3.

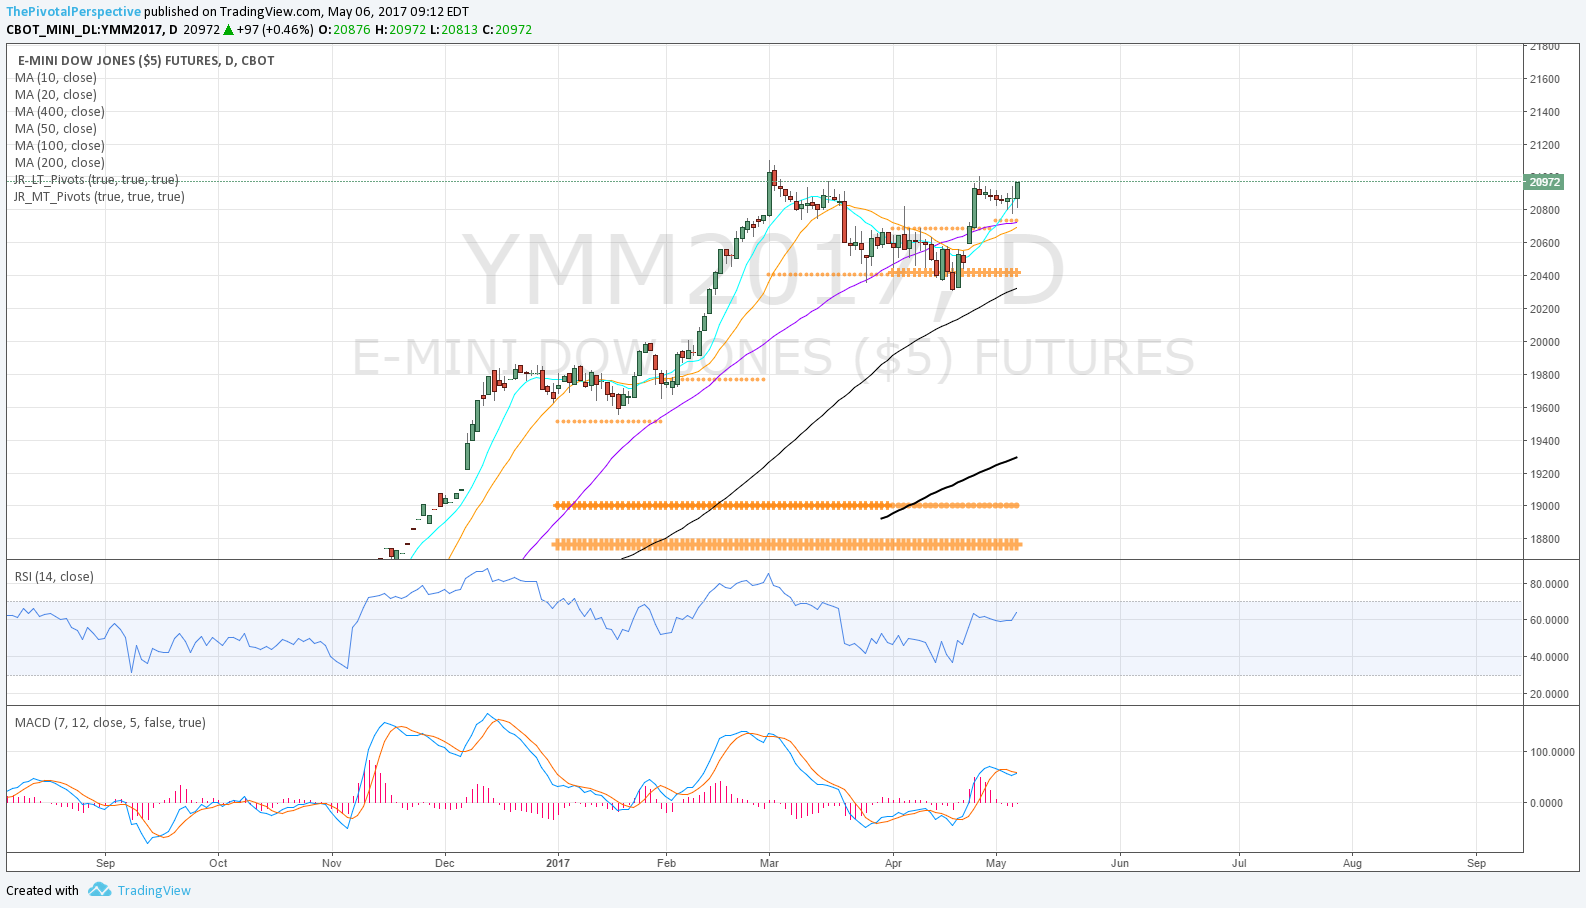
INDU / DIA / YMM / YM1
INDU holding 1HR1 as support looks more bullish.
Back to MayPs but DIA testing level and not clearly above.
D50MA still appears to have negative slope.


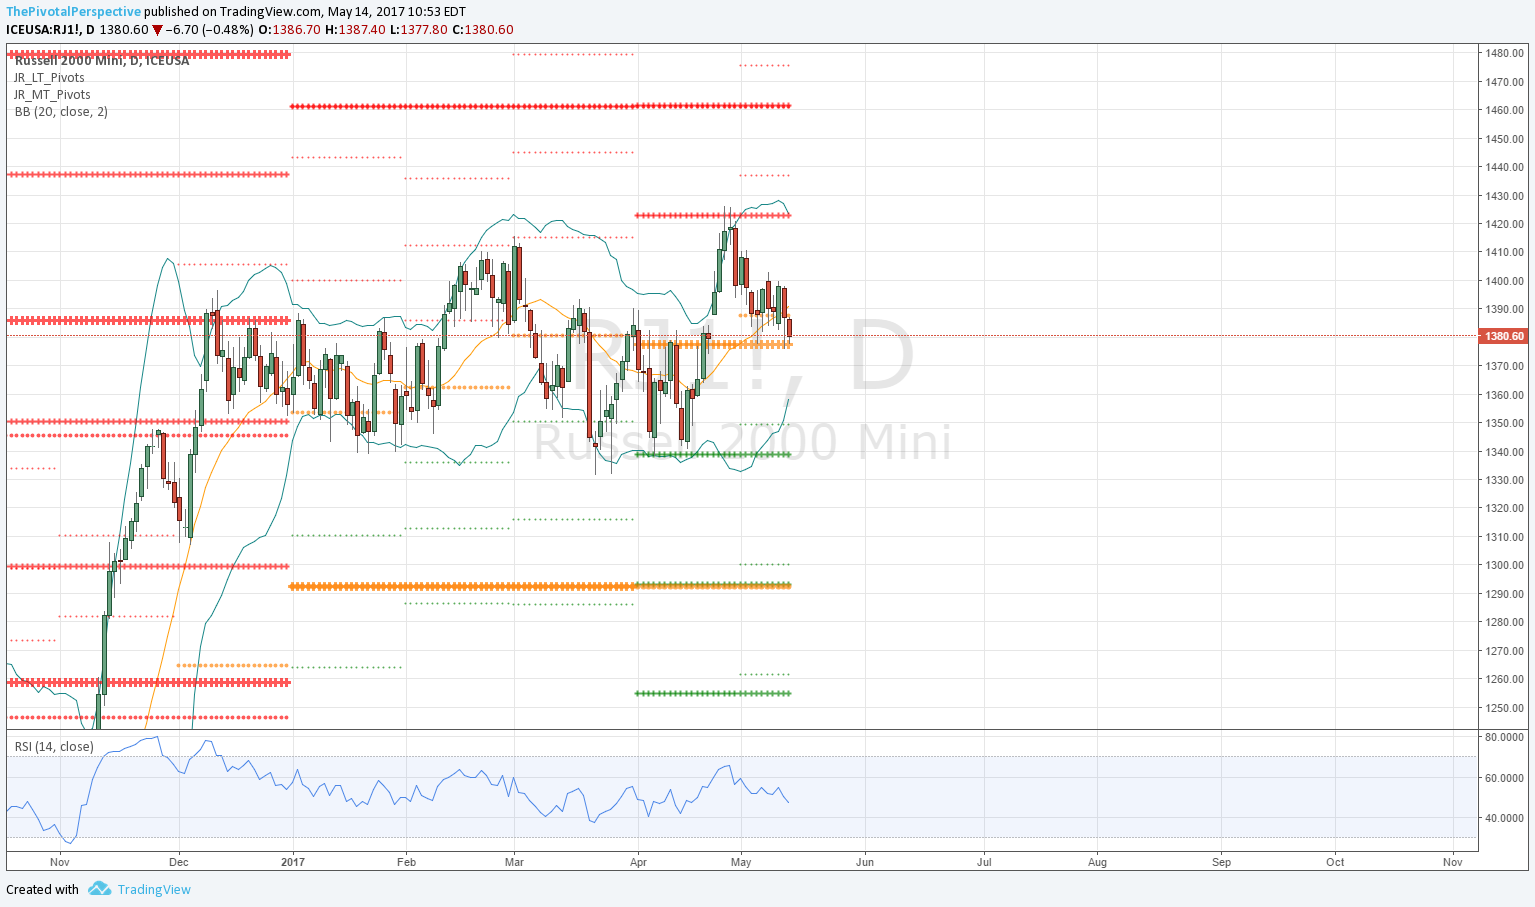
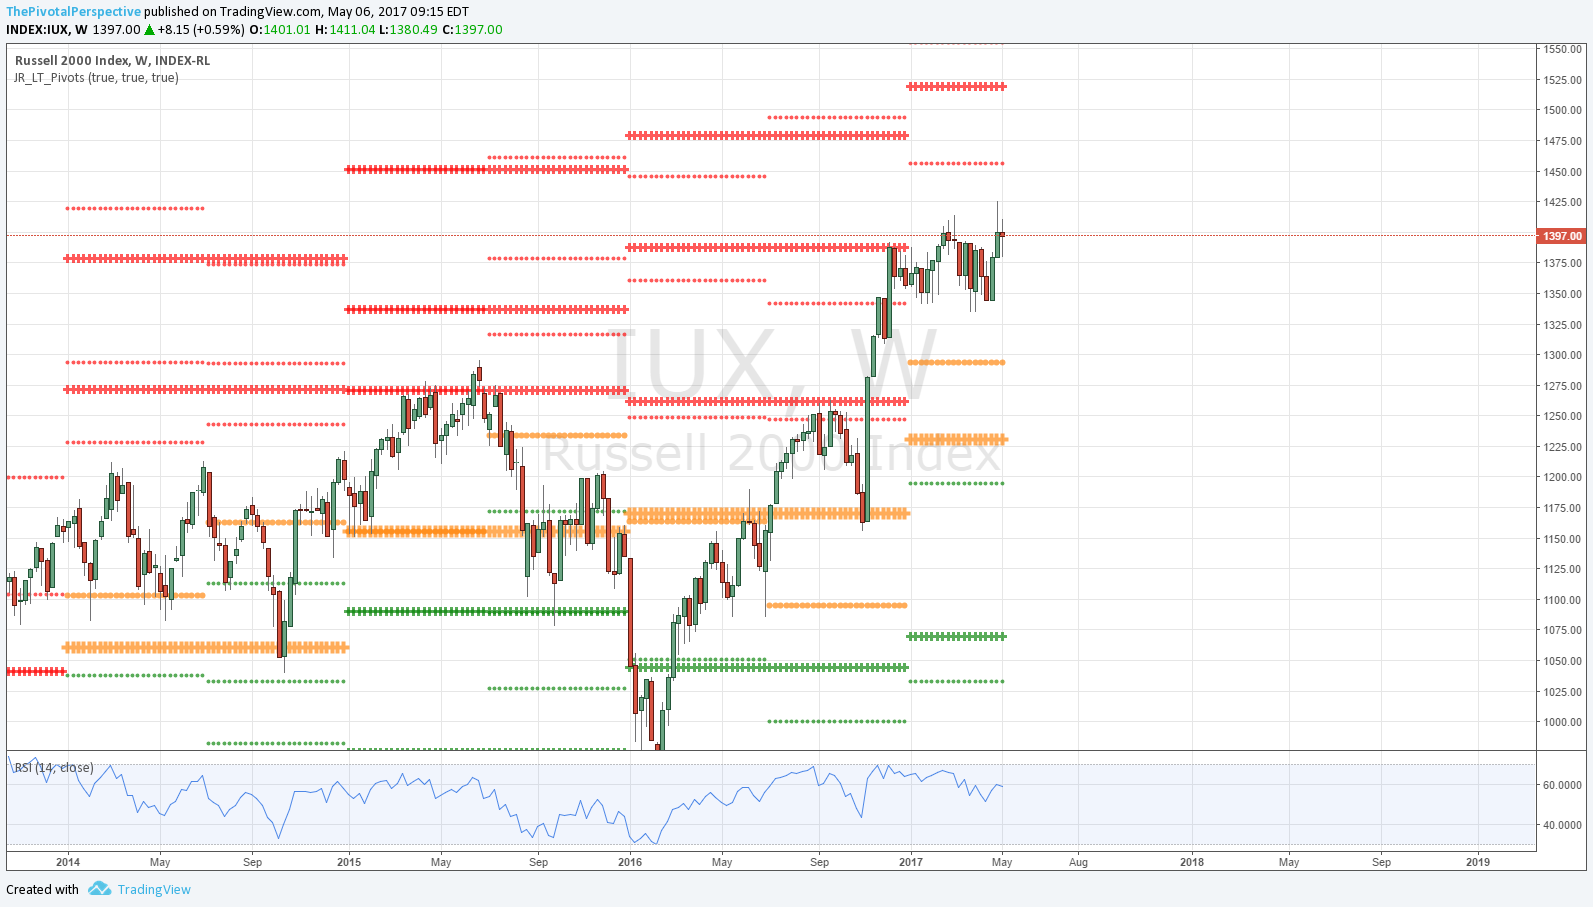
RUT / IWM / RJM / RJ1
Weekly chart between levels.
IWM 2nd break of Q2P and still below, although did hold MayS1 on the low.
D50MA and even D100 are flat.


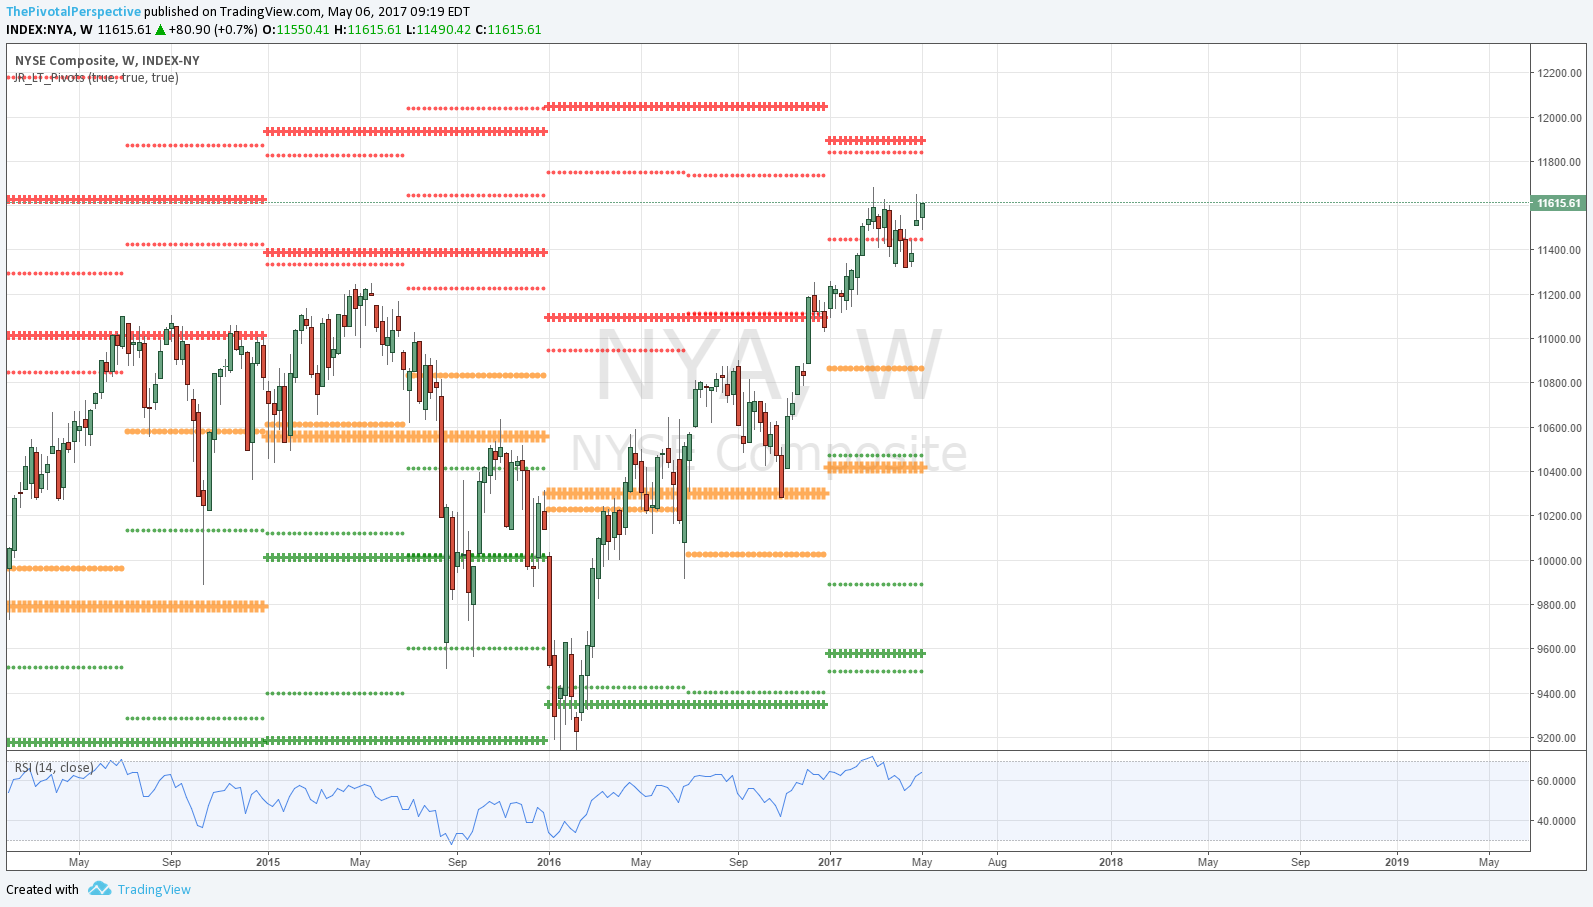
NYA & VTI
Both selling from double top area, but both back above all pivots on Friday gives bulls benefit of doubt.