I really like trading these because often more volatility both up and down than USA indexes, but often don't have time to do full blog post.
In 2014-15 while at the fund I was all over the China rally and drop, and of course with oil crashing Brazil and Russia got hit too. On this site I started highlighting EWZ in February 2016 as a relative leader on the lows, and mentioned it frequently after that along with semiconductors. EWZ finished 2016 up 61% and actually put in 122% rally low to high tick for the year, so think about that for performance opportunities.
This year the story so far is India and China tech. I am kicking myself for not playing KWEB because I even posted on that end of Q4 2016, but life got busy in January 2017 and I just didn't have the same time for usual chart analysis. INDA is doing great at 19.5% YTD and portfolio has caught some of that move, but saw on finviz that small cap India ETF SCIF is up over 40%! This means in ETF land the best things to own have been India small caps, China tech, India in general, USA tech, and EEM. This is while Trump favorites financials and USA small caps have done very little.
In general the indexes I track are: ACWI, FXI, SHComp, EEM, INDA, RSX and EWZ, and recently added KWEB to that list. I don't really use ACWI as a trading vehicle, more like global counterpart for NYA/VTI.
ACWI, INDA & KWEB lead
EEM also strong
FXI weaker but testing Q2P
SHComp testing YP / 1HP combo - any lower and below all pivots, already 1 failed bounce
EWZ better than RSX but struggling at resistance and looks ready to drop
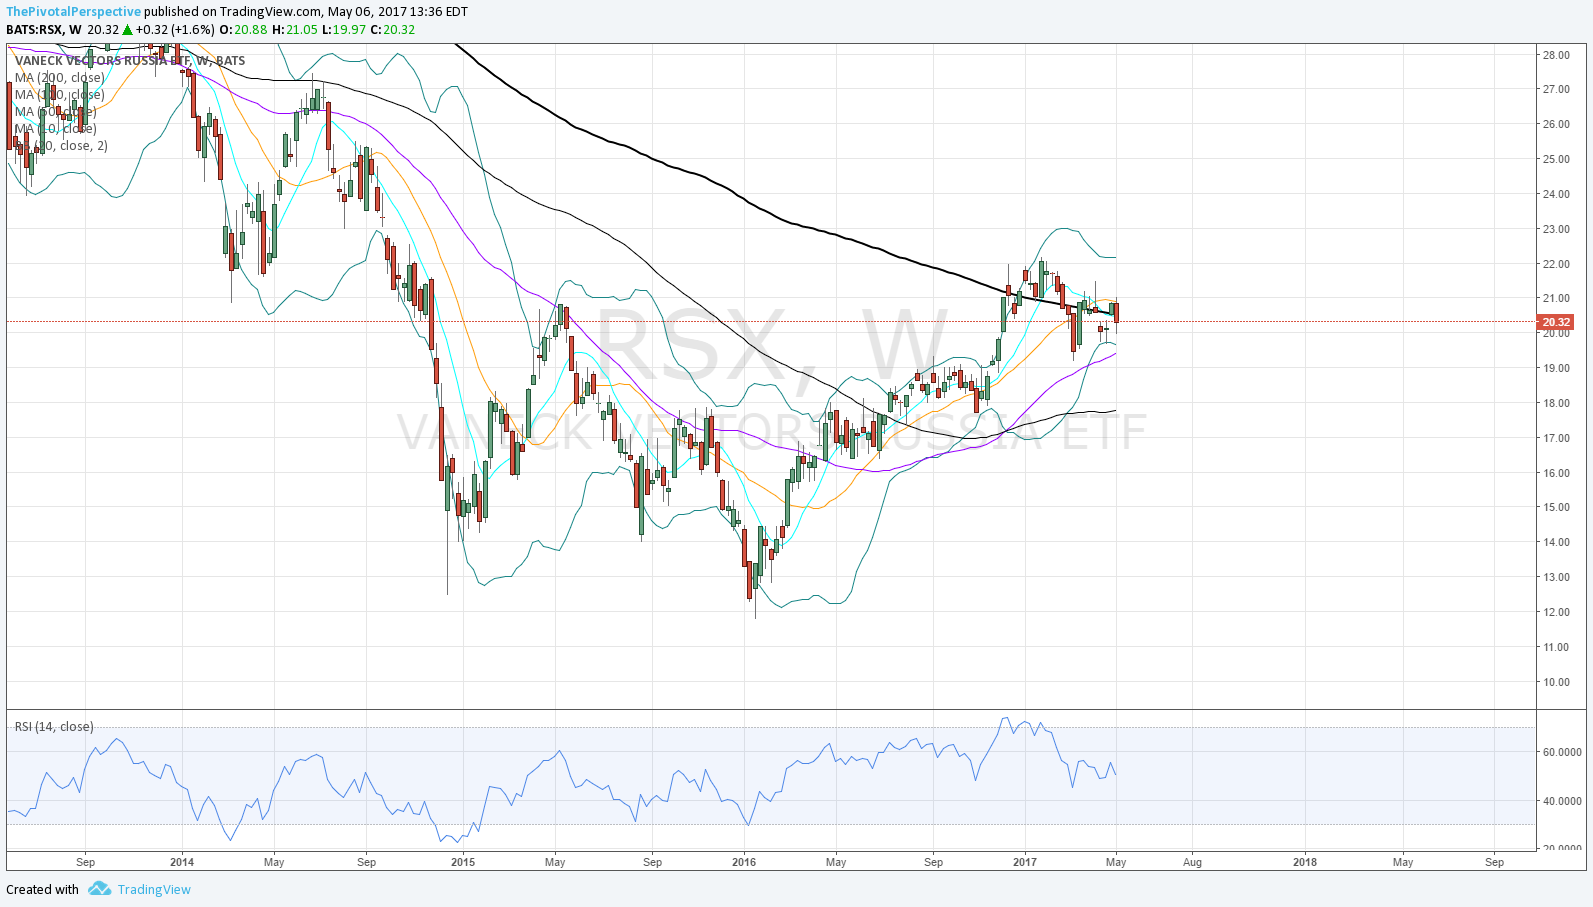
RSX below Q2P, still fighting back to hold 1HP again - some chop around this area along with weekly 200MA
Charts for each are a weekly with standard technicals, weekly pivot, and a daily pivot chart.
ACWI
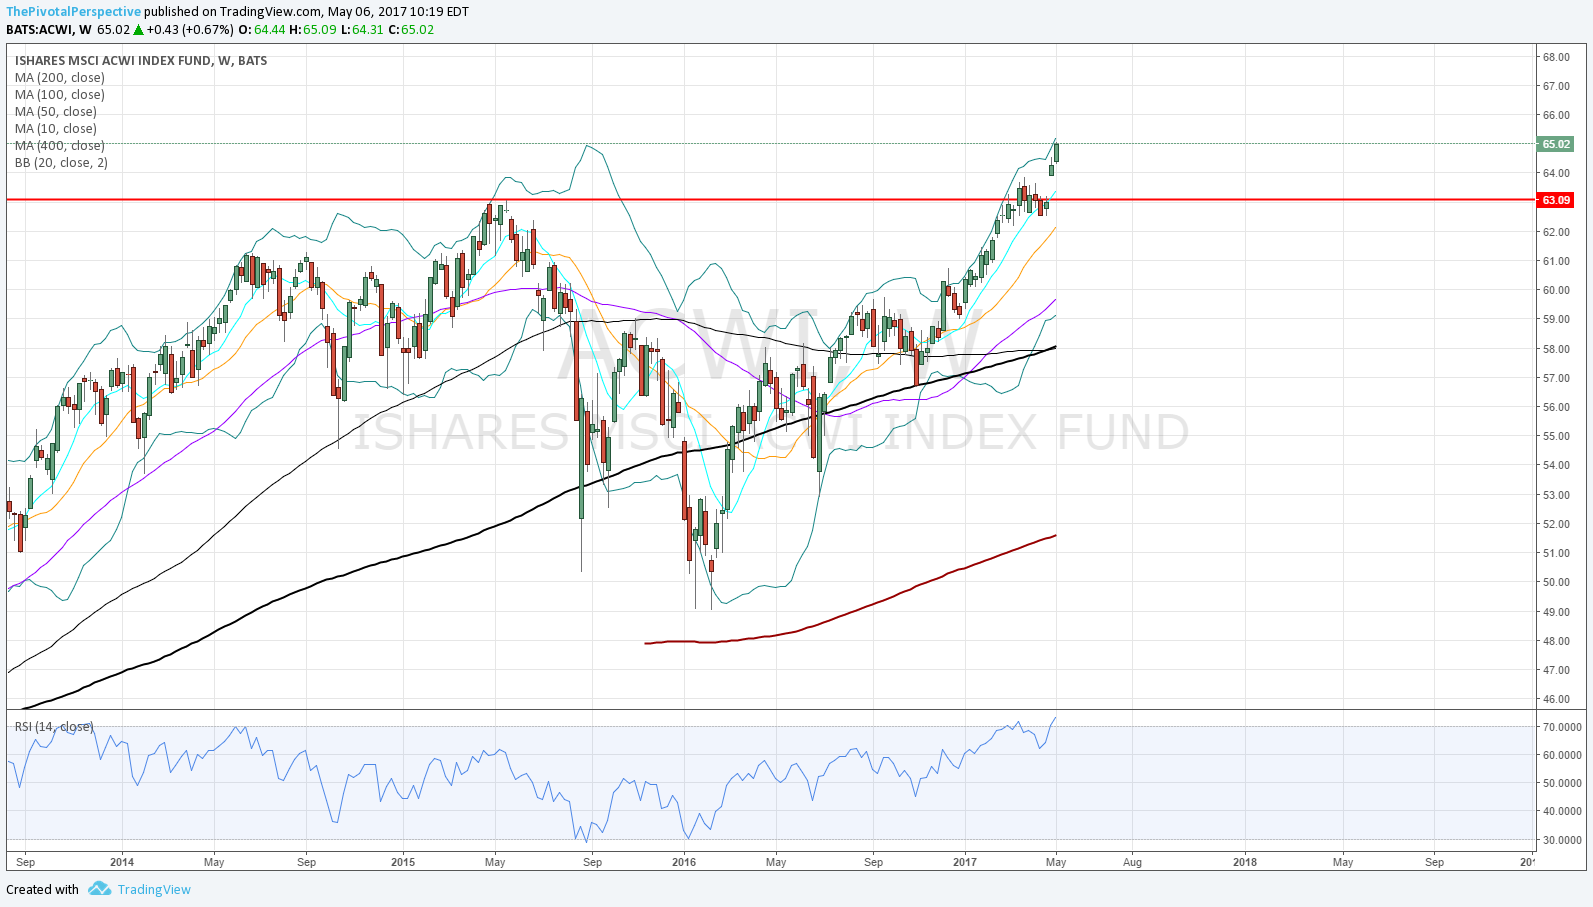
Wow, powering up and very nice new highs on 5/5. Above long term resistance YR1 and 1HR2. Q2R1 only concern here along with daily RSI OB, but the weekly charts look like 2nd week above major breakout which should have more to run.
FXI
Weekly 200MA in thick black tried to lift but failed. Still above rising weekly 20 though.
Top on YR1, and below 1HR1 as well - weaker.
Slight break of Q2P but decent recovery on 5/5. Also note massive selling from that YR1 level.
KWEB
New highs.
Weekly chart lift above YR1 looks good.
Daily chart testing Q2R1 but may clear.
SHComp
Weekly chart from 100MA through 20MA no bounce and down to 50MA.
Testing YP / 1HP combo!
Daily chart already shows one failed bounce from YP.
Any lower and SHC is below all pivots.
EEM
Weekly chart above rising 200MA, much better looking than FXI.
Pivot charts above YR1, also more bullish.
EEM doing fine, but any more weakness in FXI would drag this lower too.
INDA
Should be able to reach 2015 highs given strength thus far.
Nicely above YR1.
Daily chart also above all pivots.
RSX
3 tries above that falling weekly MA and 3 breaks.
But 1HP not giving up yet.
EWZ
Above the weekly 200MA, but weak bounce could easily drop back down.
1HR1 resistance for several weeks.
Daily chart broken Q2P 3 times only to have 3 comebacks.
Not giving up but looks ready to drop.


