Total market view

REVIEW
4/23 Total market view: "The fact is by the end of last week nearly all USA main indexes recovered Q2Ps, an overbought VIX was rejected by 1HP, and these were happening as some sentiment meters were recently bearish. These are often the best times to take a stab on risk assets."

Risk taking indeed rewarded with the gap up on Monday and one of the better weekly gains for the the markets in 2017.

Sum
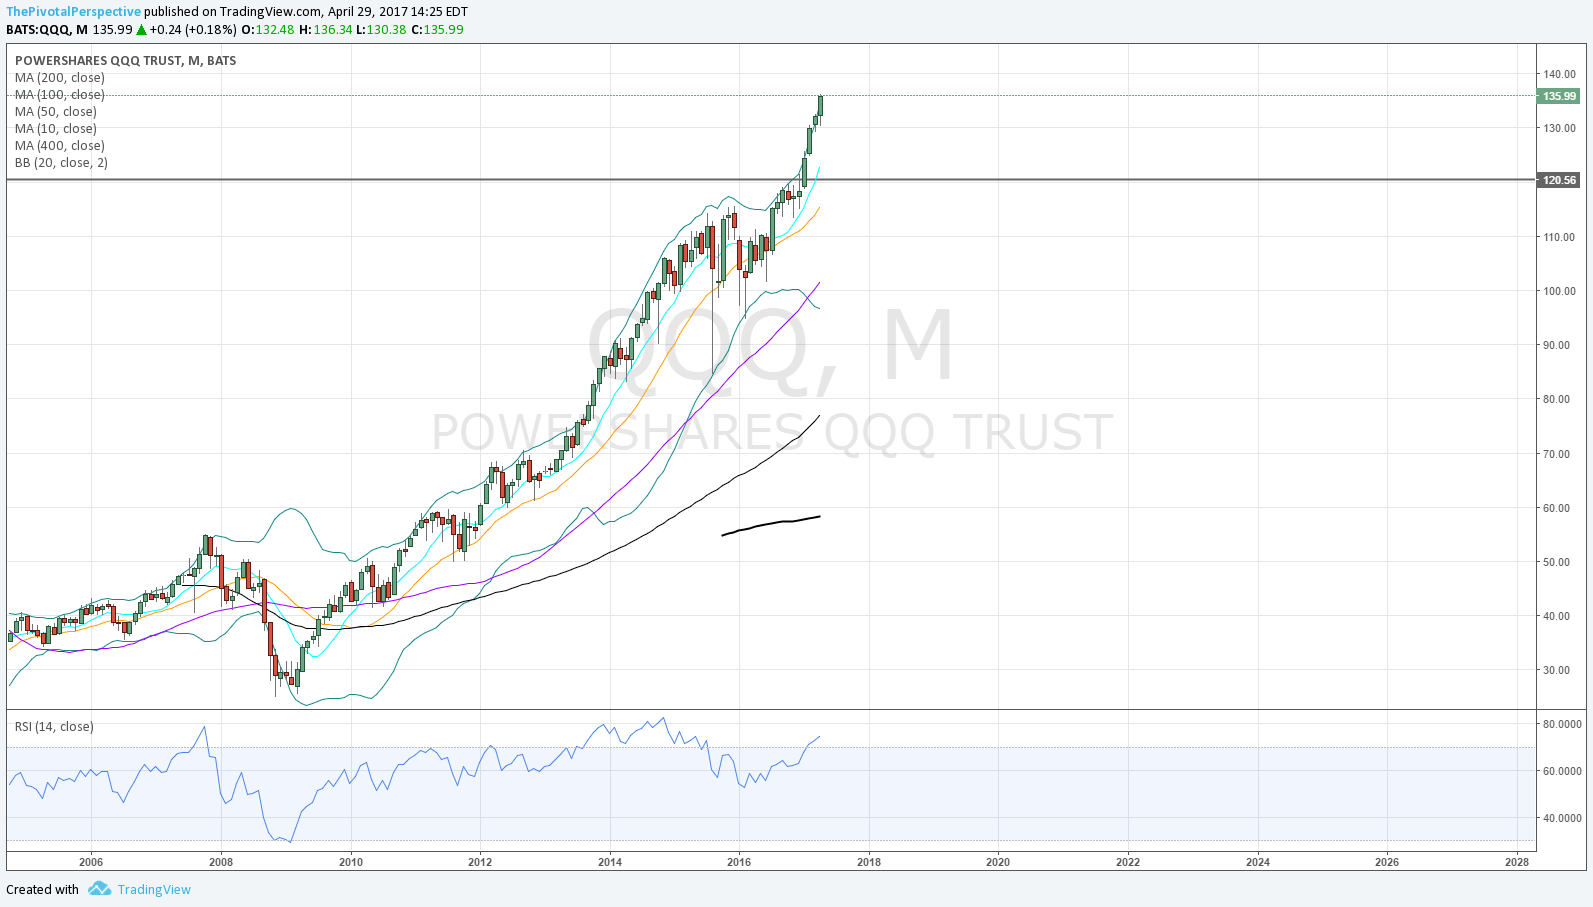
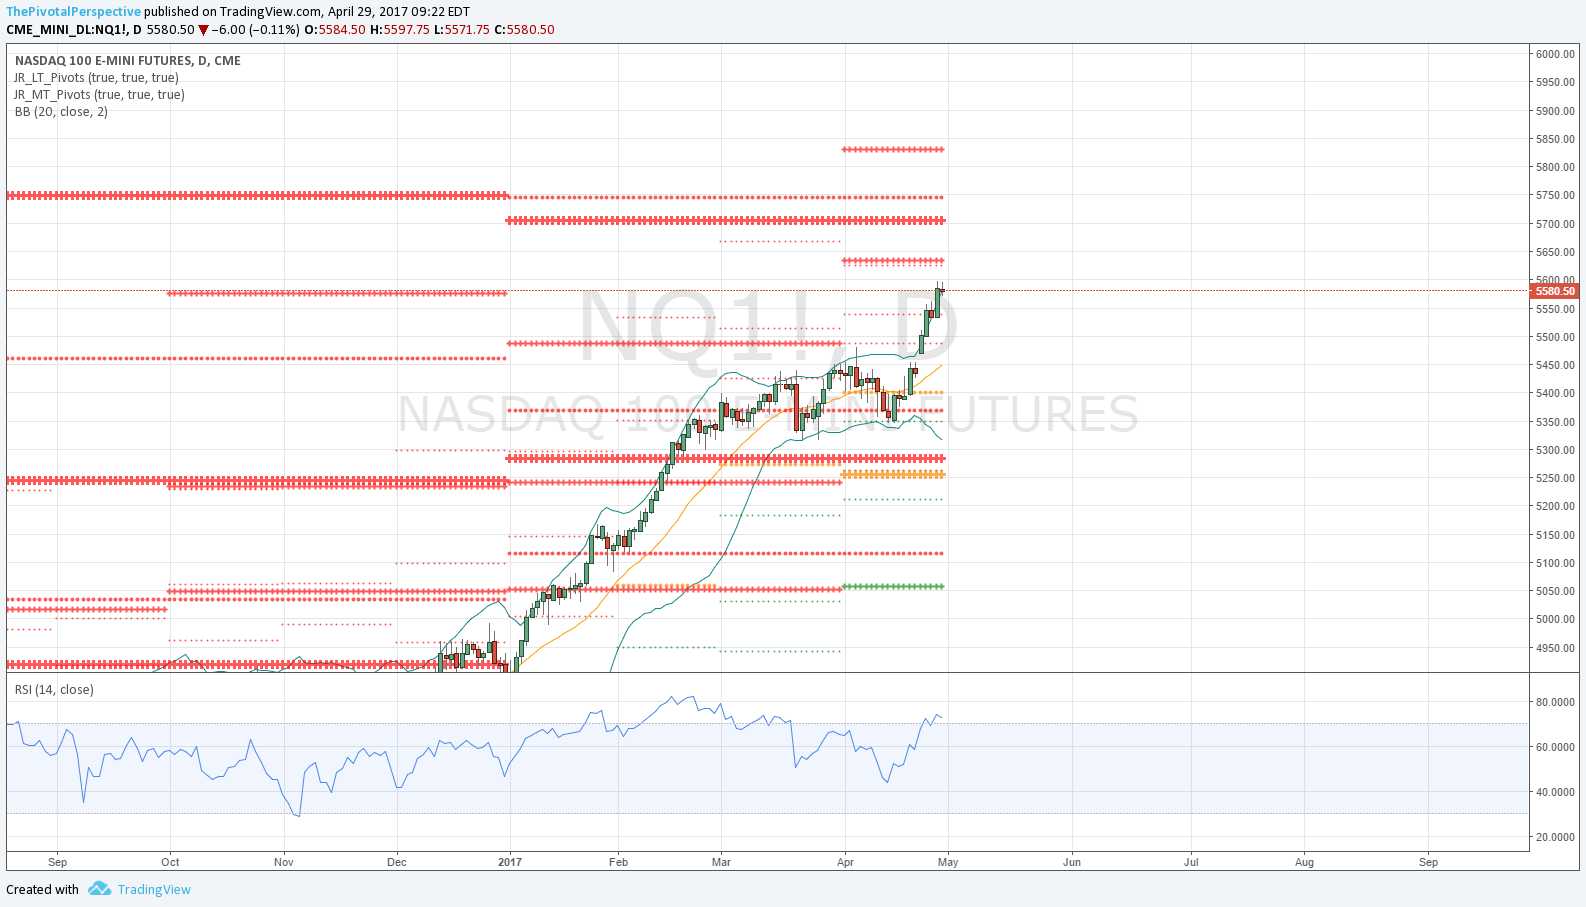
2017 USA main index leader QQQ is doing great. A case could be made for staying bullish risk assets as long as the leader is above Q2P. But as I am not long entirely all QQQ means it is warranted to pay attention to other indexes, and there are several signs of caution. These are:

SPX set near 1HR2 tag and rejection.
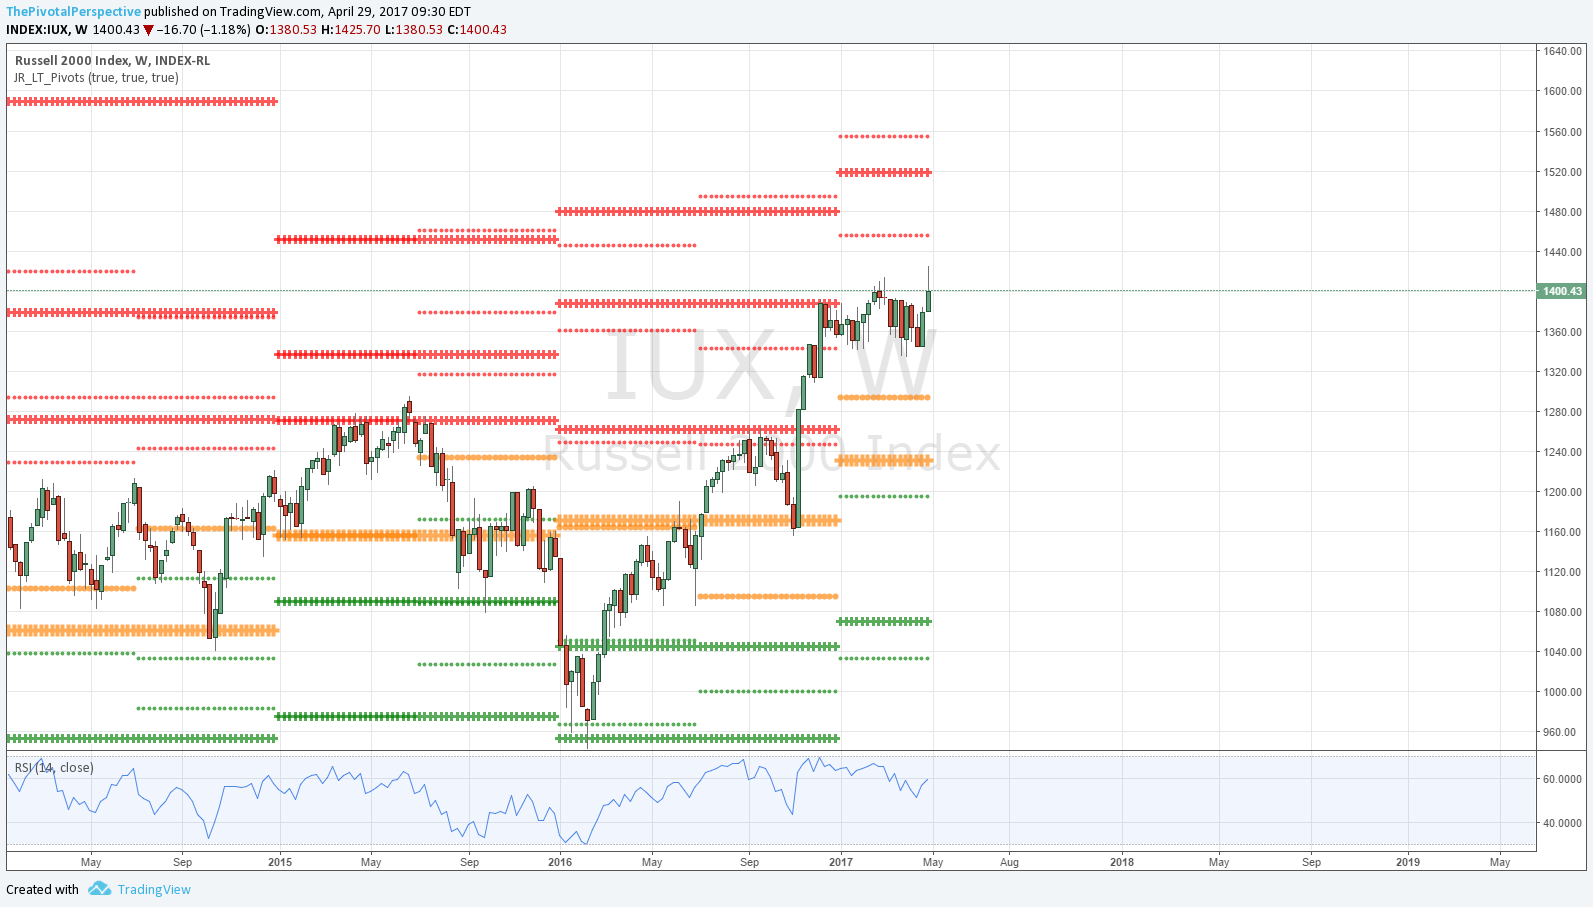
Smart money double top as outlined on that post, as well as NYA/VTI similar move, and RUT/IWM high failure.
Valuation at 18x forward earnings, and fundamentals disappointing.
Sentiment meters picking up including an ISEE spike on 4/27, often limiting upside.
Several monthly USA main index charts showing Bollinger band divergence, often prelude to a turn.
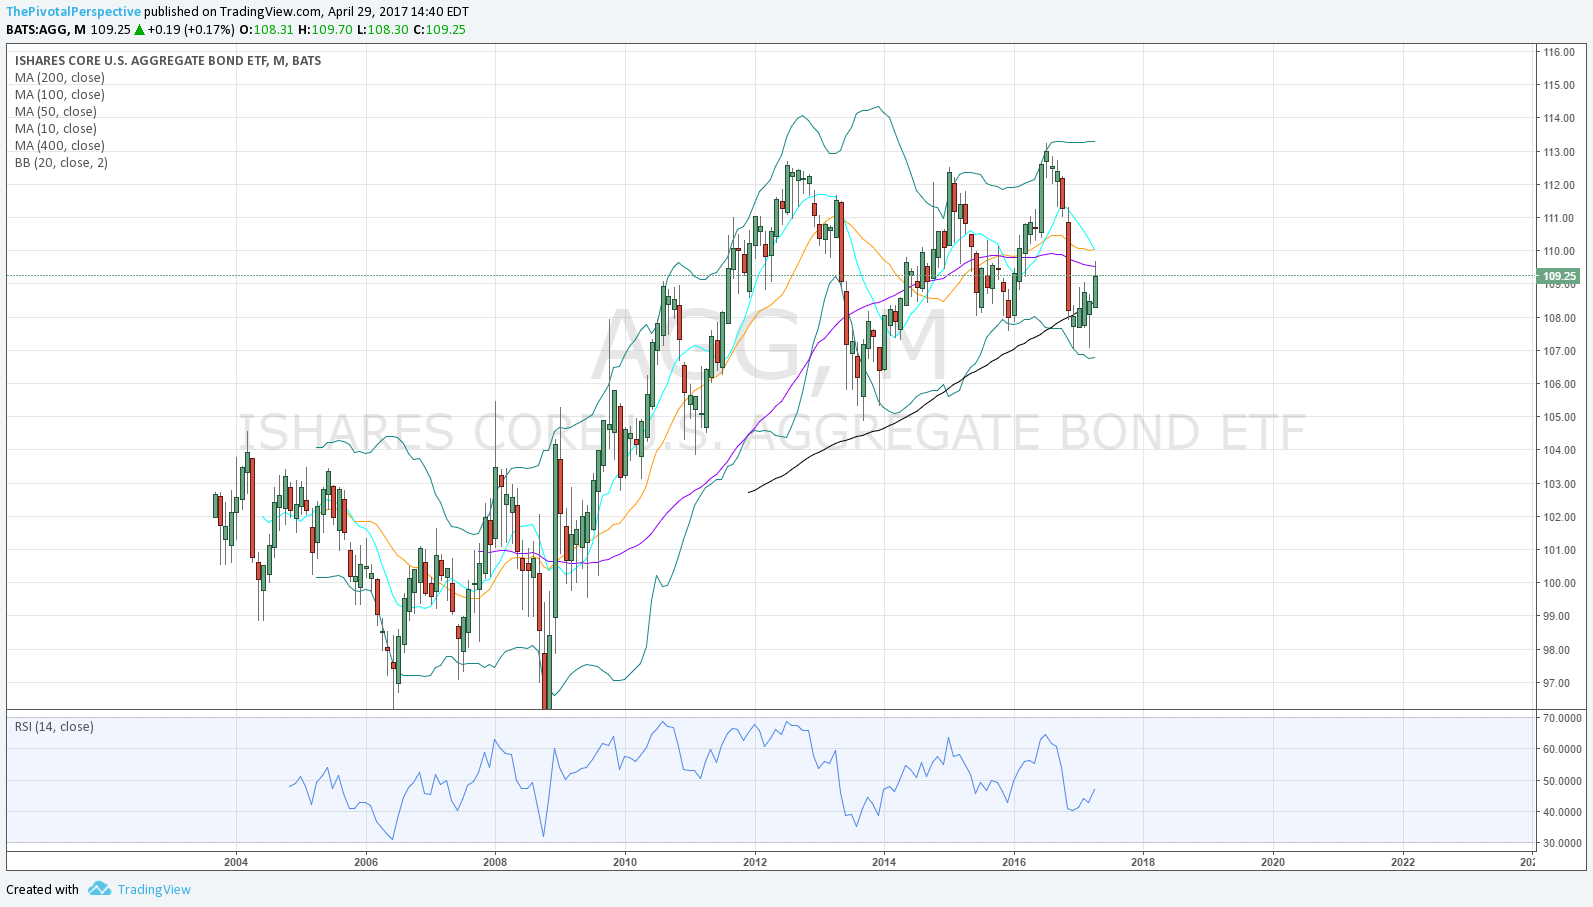
Ongoing Q2 safe haven strength.
Advance decline volume difference chart indicates risk of larger drop.

Reasons to stay long:
Trend is up, and USA mains will likely be above all pivots.
VIX below all pivots, XIV above.
Only 1 sentiment extreme often not enough to really turn.
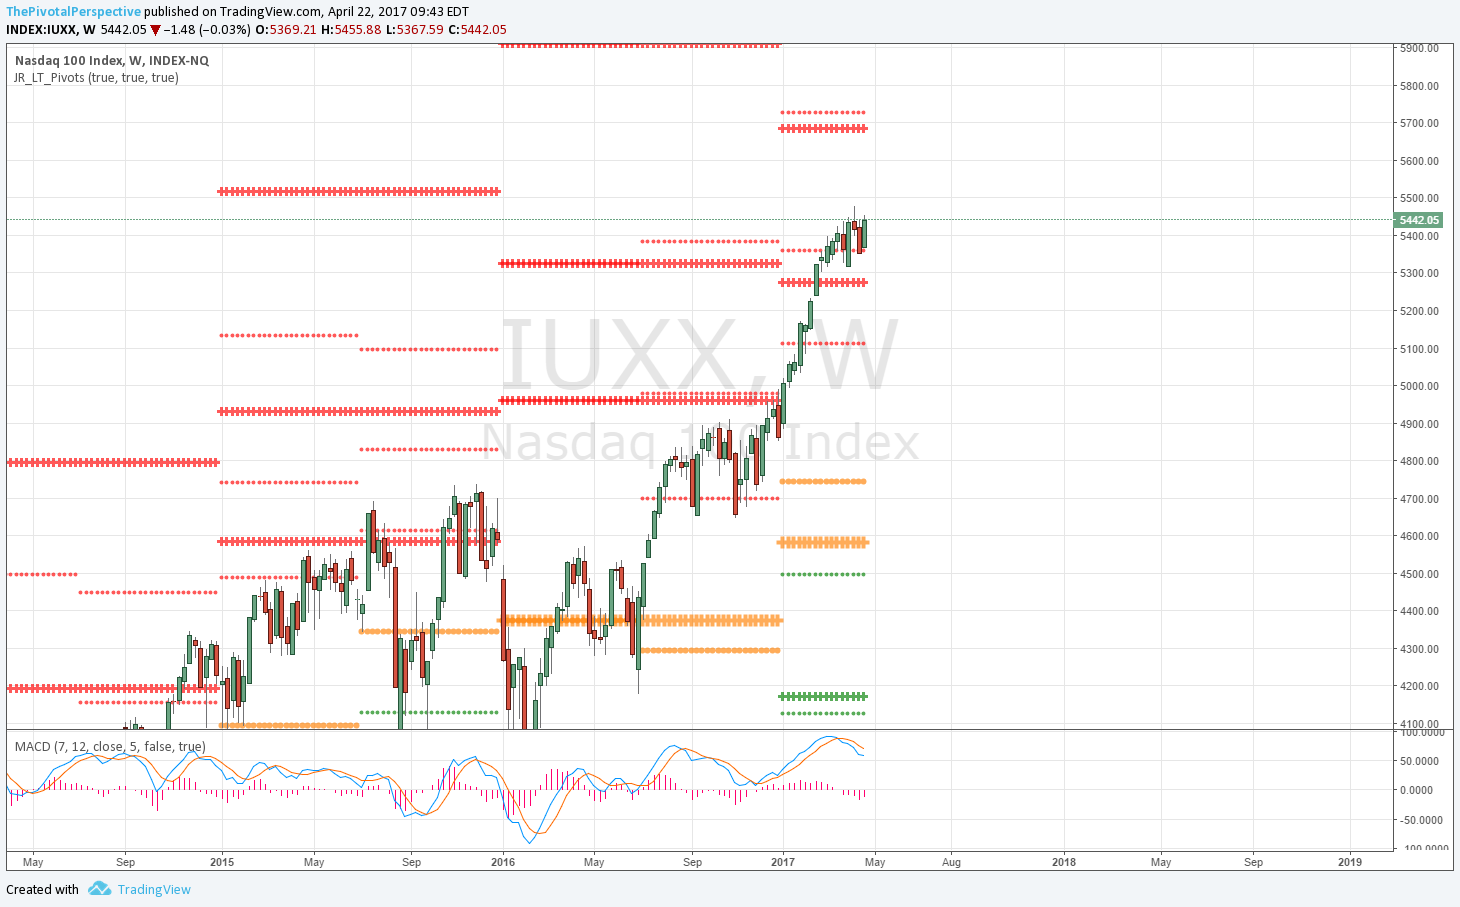
Better top at multiple long term resistance levels like SPY YR1, QQQ YR2, DIA YR1, VTI YR1 (IWM is ?), as outlined here in this target post.

Bottom line
Market is really a toss up here, so we will see if MayPs hold for USA main indexes this week. If so, will maintain positioning. Even before the rally last week thought this leg would not have the same gains as Nov to Dec or Jan to March for USA indexes. But if MayPs hold there is the chance we see the higher target levels listed above.

Positioning
Still somewhat aggressive despite not liking IWM action on Friday and concerns above.

PIVOTS
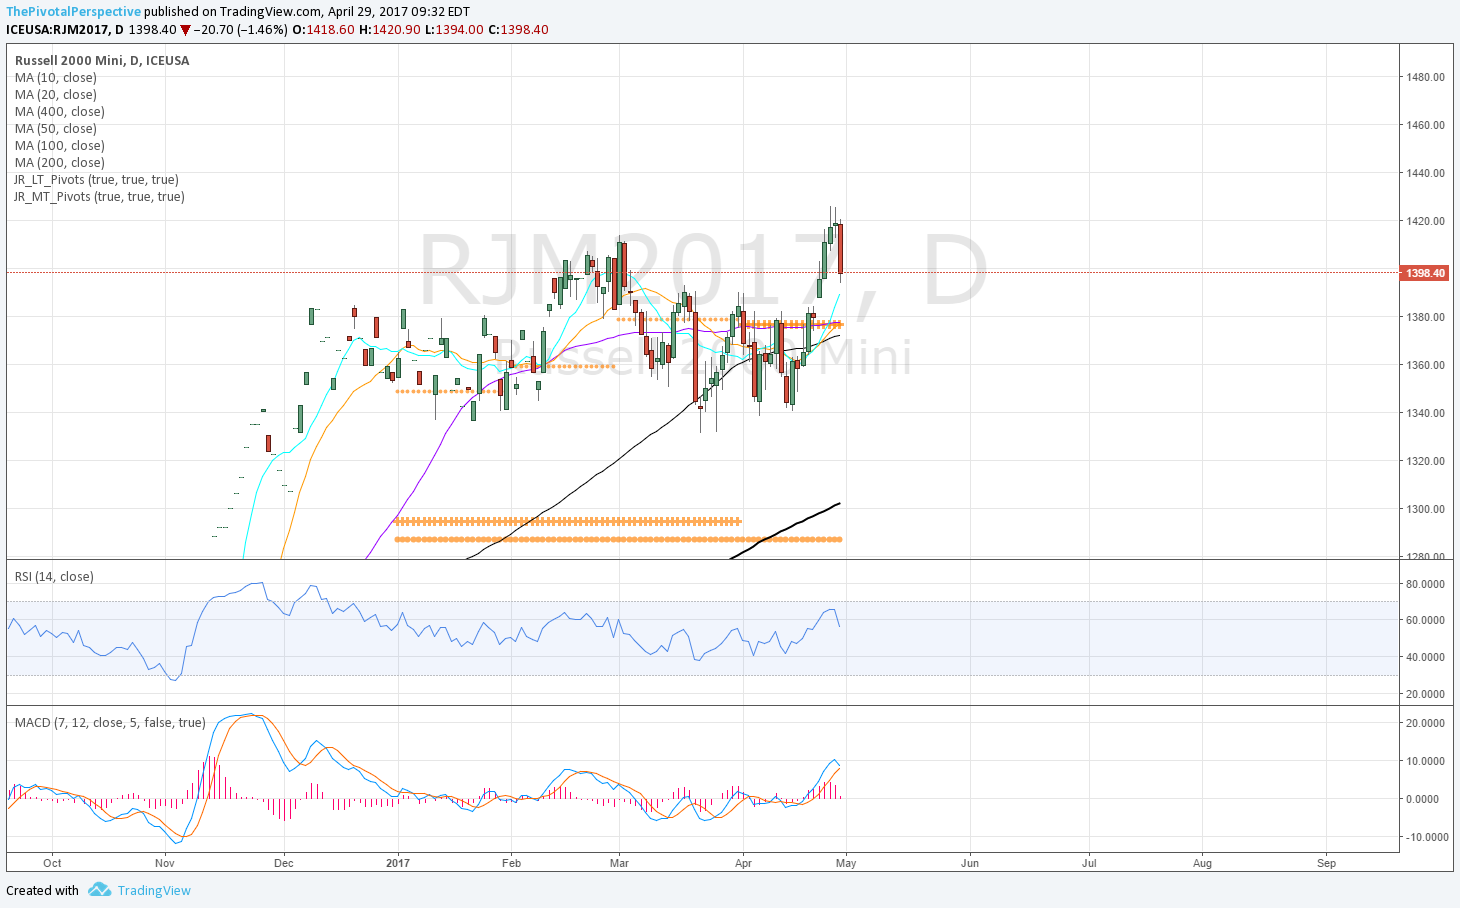
New May pivots this week. The monthly levels were clear resistance for several USA main indexes in April, and that led to a test of Q2Ps. Reducing in front of the drop and buying the dip was a good move. 

USA main indexes - A nicer top would be at more pivot resistance levels, although IWM clear rejection from Q2R1.

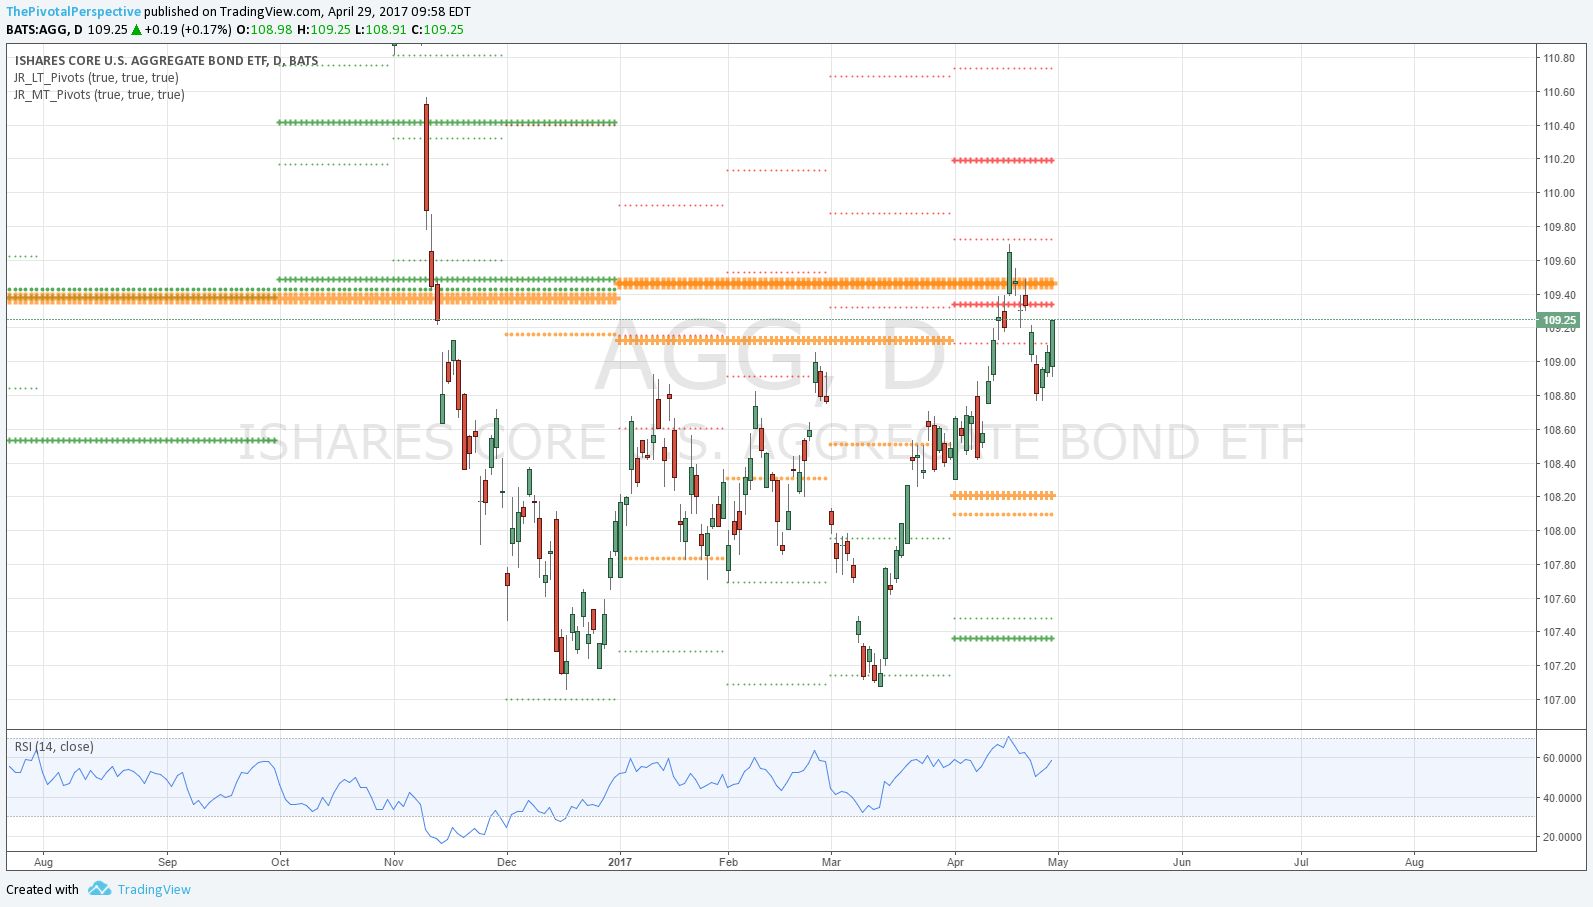
Safe havens - VIX and XIV supporting risk, but GLD above all pivots, and TLT & AGG strong comeback after first fade. 

Sectors of note - XLE hanging by a thread. In addition, SMH monthly chart vulnerable to selling.

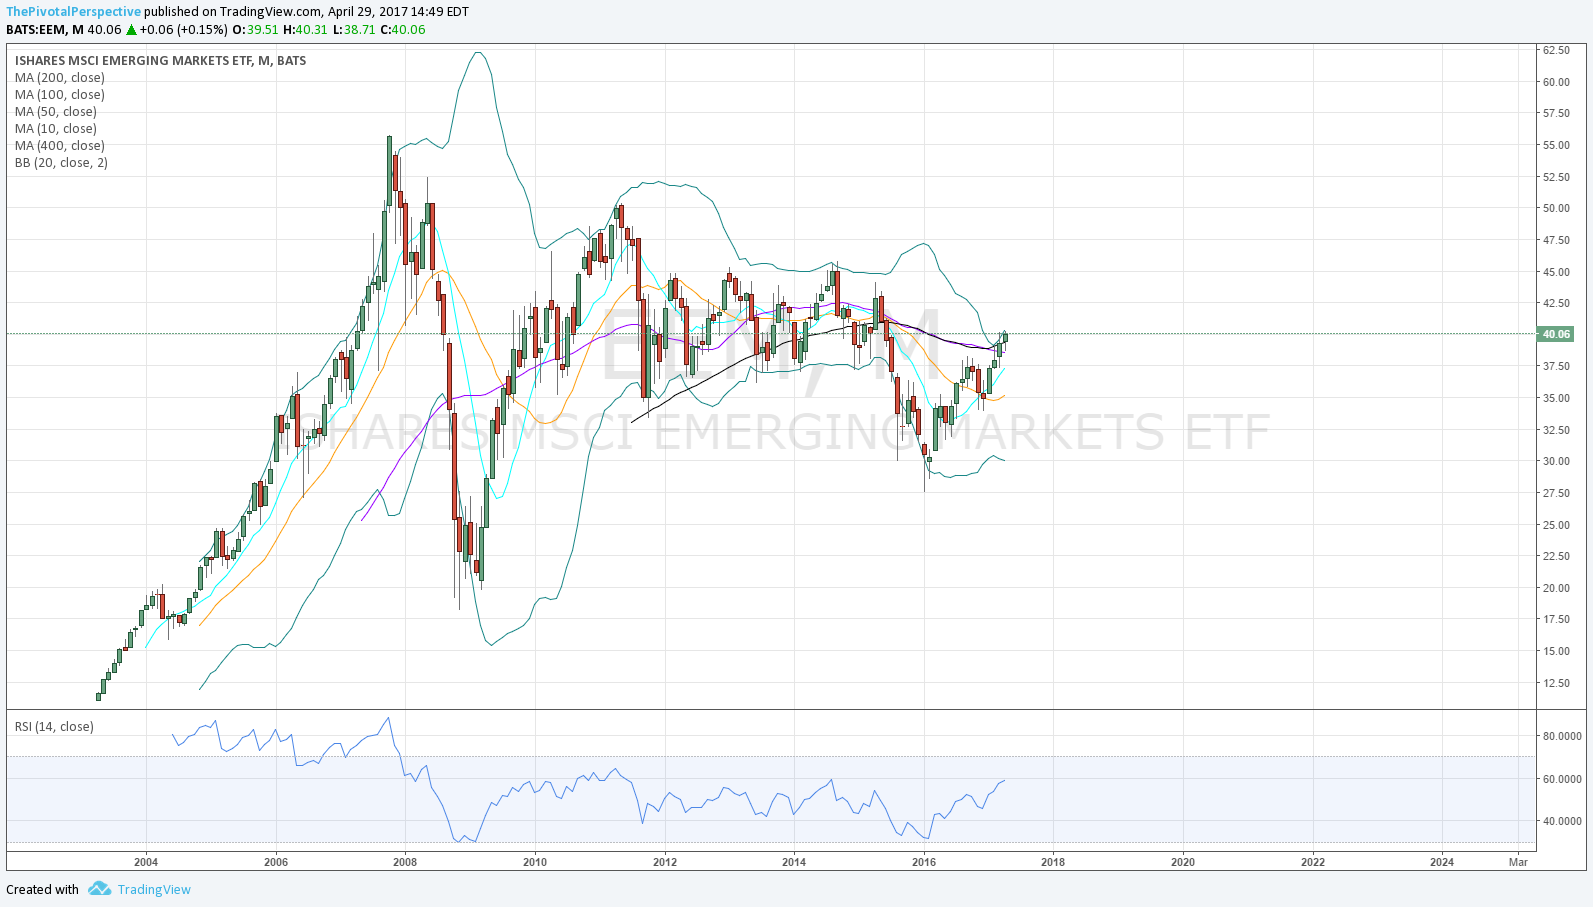
Global stocks - ACWI, INDA and EEM all doing great. RSX possible short.

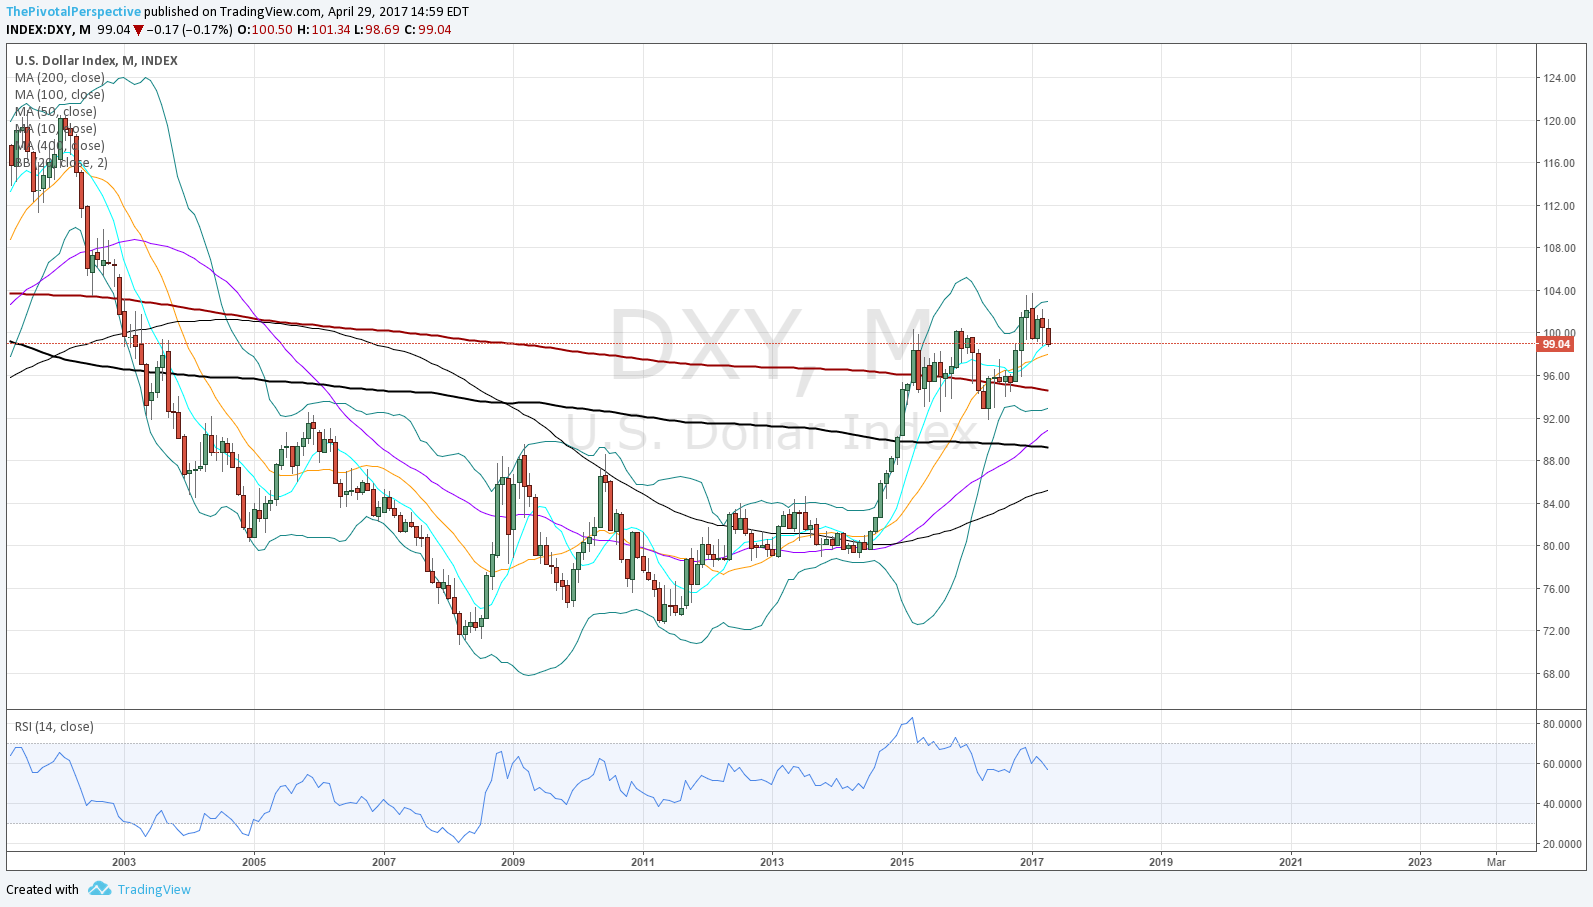
Currency and commodity - Oil still above some pivots on the CL1 contract which I have found to give the better signals. DXY under all pivots the last week, which helps support the global positioning. 

OTHER TECHNICALS
Rundown of monthly charts here. Not a lot of strong edges. USA stock indexes all up, but some divergence. See the sum at the top of that post.

Advance decline volume difference is one of the list of concerns above. I wish there were more history to this and will check further this week into other sources. Point is 7/2015, 12/2015 and 10/2016 were all times the level was similar to today, and the market put in larger decline than a -2%. 

VALUATION & FUNDAMENTALS
Not helping. Based on Citigroup Economic Surprise, there is slim chance of powerful new highs. 

SENTIMENT
ISEE spike with market at highs tends to limit upside in weeks ahead. AAII bearish sentiment alleviated. 

TIMING
(Proprietary experimental work in progress model)
See this post for a recent timing score. 

April dates
4/6-7 - minor stock low
4/10 - key lower high for USA main indexes
4/19-20 - 4/18 safe haven high (-1 day
4/26 (listed all month turning out some high for SPY, DIA, IWM & VTI)

May dates
5/3-4
5/19 (stronger)


Positioning

Came into week with 10 longs or 100% long via:

1 QQQ (12/7)
2 INDA (3/3 & 3/28)
2 EEM (3/13 & 4/3)
2 SPY (4/17)
2 IWM (4/20)
1 KWEB (4/20)

Per Daily comments after close, made these adjustments:

4/24: +2 SPY, leverage long 120%
4/25: None
4/26: None
4/27: None
4/28: Perhaps should have taken IWM off, but didn't specify.

For the current week MayPs will decide. IWM got crushed 4/28 and with VIX reversal may have been better to exit. At the same time, end of month selling often reversed in the new month. We'll see what happens. 

Q1 Positioning results

This isn't audited, but I calculated all the moves and weightings I have suggested for 2017 Q1. It wasn't great - about a match to SPY at 5.73% not including commissions, leverage costs which are not so much considering the ETFs I am using almost all have leveraged versions, or slippage. But if you followed suggestions in 2016 Q4, with IWM, DIA and XLF overweight, you would have crushed it. 

I'm not doing all this to match SPY so let's see what happened. Consider that 2017 Q1 positioning entered with IWM, XLF and DIA and all of these underperformed SPY for Q1 overall. So how did I match? Gradually rotated out of IWM, and caught some XLF on the gain, then got out of that somewhat decently. While later in the move, I did rotate into EEM and INDA before significant pops. And a few hedges made a bit of money too. 

Key mistakes were trying to hold the 2016 Q4 winners and not just going to more cash and rotating into the new buy signals on QQQ, EEM, INDA, etc. I think this is key point going forward - I just have seen so many definitive moves at the start of quarters. In fact a leveraged fund could trade these moves by doing analysis the last 2 weeks of each quarter, being very active the first two weeks of the new quarter, then monitoring from there for 2-4 weeks, and having a 4-6 weeks off after that. :)

But jeez it would have been so easy to decently beat SPY just by having overweight QQQ or SMH or most especially my pick from 2016 Q4, KWEB Chinese internet ETF, double the gain of QQQ. Day job got busy in January and I just didn't have my usual time for analysis, but before I go on too much in a way that sounds like excuses, that is what happens if you actively manage. Some moves are missed. Too bad. 

I don't mind if matching SPY is what i consider a very mediocre quarter. 2017 Q2 is doing OK. Major calls correct on the 3/1-2 highs and then both 3/27-28 low and 4/17 rebound that mattered, but portfolio got chopped a bit when market was hammering out lows last week. Also, key point, safe haven strength was noted but not traded - I will be including safe havens in portfolio positioning going forward. 


Monthly charts

USA mains: SPY QQQ DIA IWM VTI
Safe havens: VIX XIV GLD TLT AGG
Sectors: XBI SMH XLF XLE
Global: ACWI EEM FXI SHC INDA RSX EWZ
Currency & commodity: DXY CL1 USO

Sum
QQQ amazing and leading all. But other USA indexes showing Bollinger band divergence, a warning sign of potential turn. Trend still gets benefit the doubt. 
VIX and XIV supportive of risk assets. GLD reclaiming 50MA, a positive. Both bond ETFs decent advances but my guess is down for the next bar. 
Biotechs looks positive, but semis putting in textbook doji bar something to watch. XLE hanging by a thread. 
Global stocks mostly strong, especially ACWI, EEM, FXI, and INDA. SHC, EWZ and RSX less so - RSX potential short.
DXY holding MAs, but sliding, no call. Oil looks better on CL1 chart but ETF is terrible. 

SPY
Trend up but BB (Bollinger band) divergence, potential negative. RSI still above 70 helps. A combination of BB & RSI divergence would be more clearly negative. 

QQQ
Amazing. 

29 61 QQQ M.png

DIA
Bollinger band divergence, and April close barely above the last up close of February.

29 62 DIA M.png

IWM
Bollinger band divergence, and wick invites sellers. 

29 63 IWM M.png

VTI
Bollinger band divergence. 

29 64 VTI M.png

VIX
10.42 is the monthly close low of 1/2007.

XIV
Holy camoly - fell back inside BB only to rally back and close outside. 

GLD
Above M50MA for the 2nd time since 4/2013.

29 67 GLD M.png

TLT
Rallied back above M50MA, but wick invites selling. 

AGG
Decent advance, and above M100MA helps, but stopped at falling M50MA. 

29 69 AGG M.png

XBI
M50MA held on the lows for several months. Approaching 61% Fib level. 

29 70 XBI M.png

SMH
Perfect doji bar! Potential monthly CIT based on this, according to candlestick theory. 

29 71 SMH M.png

XLF
Not keeping pace this year, but small down bar invites buying. 

XLE
I didn't play the short, but did recognize that the 50MA (purple) and BB would be resistance back in 12/2016. Currently holding M20MA, but if any lower, below all monthly MAs!

29 73 XLE M.png

ACWI
No BB divergence like most USA indexes. Breakout above 2015 highs is bullish. 

EEM
Above M50MA and M100MA, pushing the BB. RSI plenty of room to go up. Bullish. 
 

FXI
Weak selling that held above M10, M50 and M100. 

SHComp
Holding 10MA and 20MA potentially bullish. 

29 77 SHC M.png

INDA
Looking good!

RSX M
Two weak up bars that have held 10MA, but under the falling 50MA. Potential short. 

29 79 RSX M.png

EWZ
Closed under the M50MA as well. Looks better than RSX but still could drop. 
 

29 80 EWZ M.png

DXY
Slight close above 10MA and 20MA, but sliding. Tough call. 
 

CL1 continuous
Not the worst. 

USO M
Terrible. Below all MAs, all falling slope. 

29 83 USO M.png

Safe havens

Sum
VIX is below all pivots and XIV is above all pivots, both generally bullish for stocks. But on Friday VIX made reversal bar from AprS1. Given trend I give bulls benefit of doubt, but this is a minor mark in the negative column.

GLD remains above all pivots and successful backtest of D200MA so far. TLT faded from Q2R1 area, and AGG back under YP / 1HP combo, but both came back into the end of last week. 

Safe havens are showing some signs of caution for stocks but thus far it has paid to stay bullish risk assets until VIX and XIV both agree on trouble, and that hasn't happened yet. 

VIX
Weekly chart fast drop from 1HP down to 2014 lows.
Daily chart same move, but looks like reversal bar on 4/28 from AprS1.
Adding MAs on the next chart makes VIX look more bearish / ie stocks fine, with negative slopes.
A tag of the lower band should that happen would reach into the 9s.
VIX sum - Below all pivots and MAs. 4/13-17 and 4/19-21 both fantastic tells for the market. But 4/28 also reversal bar from AprS1 could be the start of another move up. 

29 31 VIX D.png
29 32 VIX D.png
29 33 VIX D.png

XIV
No problems here, jump back above YR2.
Daily chart reclaimed Q2P fractionally 4/17-18, broke, then again 4/20-21, back above all pivots confirming stock buys on 4/24.

29 34 XIV W.png
29 35 XIV D.png

VVIX
Maybe overkill but 4/19-21 confirming buy setups with clear resistance at YP 1HP areas, then 4/24 back under all pivots. Similarly, pivot support reached on 4/25. 

29 36 VVIX D.png

TLT
Weekly chart far from any long term levels.
Daily chart a bit above Q2R1 then fade. But still above Q2P! MayP will be interesting. 

29 40 TLT W.png
29 41 TLT D.png
29 42 TLT D.png
29 43 TLT D.png

AGG
YP and 1HP fade, but decent comeback and may try again! If so then falling D200MA looms.

29 46 AGG D.png

GLD
Weekly chart above long term pivots and far from resistance.
Daily chart fade from Q2R1.
But so far holding backtest of D200MA.
 

29 48 GLD D.png

GDX
GDX structurally weaker all year, and quick traders could have used the GLD drop to short GDX 4/21 or 4/24. But held YP and D400 combo. If long I'd rather be in GLD with more size, and save GDX for shorting. 

29 50 GDX D.png

USA main indexes

Sum
2017 USA main index leader NDX / QQQ looks fantastic, with convincing new highs, not yet at pivot resistance, and no other warning sign such as RSI divergence. Others are not in the same league: SPX and NYA/VTI both stalled at 3/1 close high levels, with SPX near tag of 1HR2 as well. RUT set reached Q2R1 but then major selling from there and back under 3/1 highs, making that look like a failed high. INDU mild drop from AprR1. 

So the leader still strong, but the others leave some to be desired. If higher, I think the SPX set YR1 / 1HR2 / Q2R1 combo will cap upside. New MayPs in play on Monday, and bulls will want to see all 5 indexes stay above these levels for better chances of another push to highs. 

Charts
Cash index weekly charts with long term levels only
Daily ETF chart with long term & medium term pivots
Futures current contract pivots only (no S/R) and MAs for clarity of entries (now June 17 M)
Futures "1" continuous contract with Bollinger bands

SPX / SPY / ESM / ES1
Weekly chart looks quite toppy here with test of YR1 1HR2 area.
SPY a bit shy of levels.
ES still on buy and MayPs will be telling.
ES1 also has red line drawn at the close highs.
SPX set sum - Trend is up but chances of a top have now increased with SPX 1HR1 near test and down as well as selling at the 3/1 close highs. If higher, then 2400-2407 significant resistance which includes SPX YR1, 1HR2 and Q2R1. 

29 11 SPY D.png
29 12 ESM D.png
29 13 ES1 D.png

NDX / QQQ / NQM / NQ1
Still superstrong and looks like it should reach YR2.
QQQ includes medium term levels and Q2R1 is the first level to reach, then YR2, then 1HR23 is above that.
NQM huge hold of D50MA.
NQ1 blasted above the prior highs.
NDX set sum - 2017 leader still doing incredibly well. 
 

29 16 NQM D.png
29 17 NQ1 D.png

INDU / DIA / YMM / YM1
Similar pattern as SPX, but not on any long term level.
DIA near tag of AprR1 though (cash index also near tag of AprR1).
YMM will likely open above MayP.
YM1 not quite at previous close highs yet. 
INDU sum - Tag of AprR1, but could come back. Major cluster above previous highs at YR1, 1HR2 and Q2R1 all 21325 to 21425, roughly. 
 

29 20 YMM D.png
29 21 YM1 D.png

RUT / IWM / RJM / RJ1
Weekly chart doesn't look terrible from this view.
But daily chart has serious concerns with rejection of Q2R1 and failure at 2015 highs. 
RUT sum - Q2R1 resistance and prior high rejection just does not look good. 

29 23 IWM D.png
29 24 RJM D.png
29 25 RJ1 D.png

NYA & VTI
These didn't reach any pivot resistance levels on the recent highs, but clear selling from the 3/1 close highs shown in red on the daily charts. 

29 27 NYA D.png

Valuation and fundamentals

Thomson Reuters reporting that 12 month forward P/E of SPX dropped as price rallied - that means earnings up. But I've been using a 10 period MA to smooth data. Here are results from 2016 Q4 to current.

Multiplying this earnings number by 18 gives the implied valuation level.

And here is SPX added in orange. 

So the index is making another test of 18x area earnings. This site has maintained for months that I expect a major top in the 18x-19x area. If earnings continue to climb, then price can go higher while maintaining this valuation. It would be negative for the earnings to level off and start dropping. Resuming positive counts towards making this a very slight positive guesstimate, +1.

*

Citigroup Economic Surprise is not helping! Back to the zero line, so let's give that a 0.

Combined rough estimate score on scale of -5 to +5 is a very middling .5. This caps upside and increases the chance of a sell in May event. 

Double top?

SPX cash chart here with red line on 3/1 close high of 2395.96 (price high was 2400.98). This is a smart money double top even though the actual price didn't reach the top tick on 3/1. 

Now adding long term pivots, 1HR1 near tag and YR1 just above. 

28 2 SPX D.png

Now adding medium term levels, though AprR1 is in play only one more trading day. Price will likely open above the MayP. 

28 4 SPX D.png

So there is price resistance at the close and price highs of 2396-2400, significant pivot resistance from 2400-2407, and last 18x forward P/E valuation resistance also 2398. But the index will likely start May above all pivots. The judgment here is whether the index gets through this resistance area. More this weekend on the blog. 

TMV special market turn

Readers of the weekly summary Total market view posts know that is where I am trying to tie different things together to understand the most likely path forward for markets, or at least know the signposts for meaningful action for the week ahead. 

Elements of the Total market view are:

Pivots
This means across the board so USA indexes, safe havens, sectors, global stocks, currencies & commodities). Trying to cover the major tradeable asset classes through ETFs but obviously scratching the surface here.

Other technicals
RSI, Bollinger bands, MACD (tweaked settings), Elliot wave, advance decline volume difference, occasionally others in the bag of tricks

Valuation & fundamentals
I've been tracking the 12 month forward P/E from the beginning of this site with a few permutations. Currently favored version is the 10 period MA of Thomson Reuters data that I enter into spreadsheet weekly

Sentiment
Not really an issue until we see low/high sides or fully on extremes, which I define as 10th / 90th percentile.

Timing
I don't mention this proprietary work in progress model too much, but it used to be more of what I focused on for the fund. I persist in a skeletal version due to events like the recent safe haven top, only 1 day off from timing window specified in advance!

Recently we had an example of several of these coming together for the 4/18 safe haven top. When all of the elements of The Pivotal Perspective come together there is a much more significant chance for a meaningful turn in markets. 

Pivots
GLD Q2R1 exact
TLT AprR2 & Q2R1 slight overshoot then fade
AGG YP / 1HP  Q2R1 / AprR1 area
VIX up to 2HP 4/13, then also at Q2R1 4/18-19

RSIs (other technicals)
Highest daily RSIs on all of these since
GLD 2/2016
TLT 7/2016
AGG 7/2016
VIX 11/2016

Sentiment
Not a pure hit, but enough bearish sentiment for stocks (ie tends to be bullish safe havens) reached early April. 

Timing
4/19-20 listed as "positive for safe havens" from 4/9 Total market view.

Key high 4/18 GLD (highest closing high), TLT (price & close high), and AGG (also price & close high) - so basically 1 day miss from timing specified in advance.

The combination of all these factors combined is why I mentioned possibility of key safe haven top as soon as 4/20 Daily comment: "Tech and semiconductors both back above all pivots as AGG has faded. This is very bullish, and given daily RSIs and long term levels it is possible that some safe havens (AGG, LQD, MUB) just made a very key turn for the year."

And then echoed this in 4/22 Safe haven post: "TLT sum - daily RSI highest in months, rally to Q2R1 area and AprR2, plus weekly BBs, has potential to be a key top."

From now on when I see a turn like this, I'll call it TMV (Total market view) special market turn. Ideal is all 5 components participating, but mostly it will be in varying degrees. 


Targets

Ideal target zones setting up for multiple USA main indexes should they all reach long term resistance.

SPY YR1 / Q2R1
QQQ YR2 / 1HR2 / Q2R1
DIA YR1 / 1HR2 / Q2R1
IWM 1HR1 / Q2R2
VTI YR1 / Q2R1

All shown in charts below with blue arrow which are at the level of the most significant (ie longer term) pivot resistance level. 

Total market view

REVIEW
4/16/2017 Total market view: "Though N Korea worries seem to have ebbed over the weekend, there are still political concerns ahead with the French vote. It is possible that VIX remains elevated, or USA stocks bounce and then fail. It is a week to stay nimble, because a hold here could be one of the better buying opportunities of the year; yet in this environment there is the risk of lower before the bottom that matters. ... VIX closing just under its 1HP of 15.99, and some SPX and INDU variations within striking distance of recovering Q2Ps, make a bounce a possibility. Should this happen with VIX reversing lower from 1HP, the portfolio will return more long, continuing to emphasize what has shown pivotal strength during this pullback. If lower, then I will likely reduce the USA index positions further."

Result
Largely bullish action for stocks last week with VIX dropping from 1HP and SPY, DIA, IWM, VTI all recovering Q2Ps (DIA had another break & recovery), and QQQ reclaiming status of above all pivots. 

SUM
We will find out Monday whether index & currency calmness was correct given French election. Perhaps after 2 spikes down and rallies (Brexit and USA election), people weren't selling in front this time yet should have been. But I have to go with what the market is doing instead of what I imagine it could do. The fact is by the end of last week nearly all USA main indexes recovered Q2Ps, an overbought VIX was rejected by 1HP, and these were happening as some sentiment meters were recently bearish. These are often the best times to take a stab on risk assets.

Bottom line
Pivots will make decisions easy:
EEM, INDA, SPY, IWM and QQQ for matter all valid above Q2Ps.
KWEB valid above AprP just due to very late entry.

In addition, safe havens testing levels too:
VIX, TLT, GLD are all at Q2R1s - so bullish for stocks if safe havens are dropping, bearish if above.

If stock indexes continue to hold above pivots and safe havens drop, then hold or even add.
If some stock indexes fail again as safe havens go up, then reduce. 

Positioning
Back to 100% long is somewhat aggressive given the market in Q2, but I think the risk reward for entries is good here based on Q2P holds. Some non ideal entries got immediately smacked last week, and the Positioning post reviews these in more detail.

PIVOTS
USA main indexes - Q2P recoveries for SPY, DIA, IWM and VTI (but not NYA) as QQQ recovered AprP. IWM also back above all pivots. That's bullish, though DIA was a struggle. 

Safe havens - Above pivots but many testing decent resistance with VIX, TLT and GLD all at Q2R1s. AGG also on YP/HP combo and this will be a very interesting decision because FOMC raising rates and and TNX supposedly heading to 3.0 according to Wall St and all that. 

Sectors of note - SMH / SOXX has been great long for about a year and I was mentioning it as far back as March 2016. Not in currently but maybe should be - like others brief Q2P break and recovery last week. XLF not looking good here and the current choice of IWM vs XLF is clear from The Pivotal Perspective. Lastly XLE demonstrating why I don't like to own pivotal weakness with a possible low on YP yet below D200 and all other pivots and fast whack back down to lows.

Global indexes - At beginning of Q2 all that I track were above all pivots. That quickly changed, but still compared to USA indexes that broke Q2Ps (all except QQQ), EEM & INDA remain above Q2Ps. I think these will continue to be the stars of 2017, like last year EWZ and RSX did well for most of the 2016.

Currency and commodity - Things could change on Monday, but right now DXY weaker than EUR says more risk of USA gov't shutdown than Le Pen mayhem. DXY 3rd test of YP this year on 4/20.

OTHER TECHNICALS
Let's not lose sight that Q2 and Apr both down for most risk assets and up for safe havens. The places where assets turn positive area also worth keeping in mind.

Also, per this E-wave idea, the "easy money" has been made and we are due for longer period of range bound grind - if higher, then not by much. If lower, then likely still bought before too much damage. This model based on SPY primarily with other USA indexes, not global stocks. 

VALUATION AND FUNDAMENTALS
Unfortunately these are not helping the market with weak data causing plunge in Citigroup Economic Surprise Index last week. Even though back to long due to risk reward opportunity, I don't think we are about to have a sustained up move. 

SENTIMENT
Sentiment lower readings reached on 2 of 4 indexes in early April. Put-call has dropped since then, but AAII even lower last week. 

TIMING
(Proprietary experimental work in progress model)
April dates
4/6-7 - minor stock low
4/10 - key lower high for USA main indexes
4/19-20 - looks bearish for stocks, positive for safe havens
4/26 TBD

4/19-20 was listed as bearish risk & positive for safe havens from 4/9 Total market view. So far TLT & GLD highs 4/18 (-1), along with key higher lows for stocks (except DIA low). So that is kind of interesting and a reason why I persist in this timing project :)


Positioning

Came into week:

1 DIA
1 QQQ (12/7)
2 INDA (3/3 & 3/28)
2 EEM (3/13 & 4/3)

2 IWM short hedges

40% net long

4/17: IWM short covers, +1 DIA, +2 SPY, +1 EWZ
4/18: none
4/19: -2 DIA, -EWZ
4/20: +2 IWM, +1 KWEB
4/21: None

Chopped with aggressive buying 4/17, then immediately taken out with DIA and EWZ fail.

I may have been too eager to buy the Q2P pivot holds and upon reviewing these entries realized everything that failed did not have rising MA or MACD support. 

Best entries: 
Pivot test and hold
Rising MA clear (more than one even better)
MACD recent cross or about to cross (tweaked settings 7, 12, 5)

While I almost never enter without a pivotal reason, it is clear that most better entries over the months & years have had two of three and often three of three conditions listed above. The impressive catches of turns like 7/8/16 TLT short and 2/12/16 DIA long were both speculative ie a short above all pivots and long below all pivots; 10/17/14 QQQ buy (before this site) held 1HP exact and reclaimed D200 so that is indeed two of three. 

Additionally, I started the positioning meter last fall to:
quantify stock index strength
emphasize current leaders
clarify when I thought leveraging and hedging were appropriate

Initially I left save havens off the possibility list just due to time and tracking. But in reality buying safe havens is easier and often more profitable than shorting, even if those shorts are hedges. It would have been better to take long exposure down by GLD, VIX and then partial TLT - though I don't regret taking gains on Q1 overweight XLF. I will try to keep this in mind for the future. 

Current
1 QQQ (12/7)
2 INDA (3/3 & 3/28)
2 EEM (3/13 & 4/3)
2 SPY (4/17)
2 IWM (4/20)
1 KWEB (4/20)

10 longs - 5 global, 5 USA

*

Positioning information
1 position represents 10% of capital.
Limits: 15 or 150% long, -50% shorts, hedges or safe havens, 200% max total exposure.
Currency & commodity positions are not included in this system.

Politics and charts

Thus far Brexit and USA election had much higher VIX spike than whatever of recent concerns about Trump, N Korea or French elections. This could change next week, but market not so concerned here. 

In a bull market, VIX RSI overbought along with pivot tests & holds have been many of the perfect places to buy. These are all pointed out in blue arrows on both pivots and RSIs, with one notable fake-out before the British election in red. 

The markets have certainly gotten politics very wrong in the past year or so. People seemed confident about the UK vote, then shocked at May win, then realized it didn't matter and stocks were a buy anyway.

There was a lot of worry about Trump before the election, and days he gained in the polls stocks went down and VIX up. Then when it appeared he was winning, stocks cratered only to recover near open and launch a fantastic multi month rally after victory.

Now stocks VIX and currencies seem to be fairly calm before the French vote. Either markets are wrong again or this isn't a big deal. In fact what we can say right now is that DXY is weaker then EUR, and perhaps more risk of USA gov't shutdown than immediate EU crumble. I reserve the right to change this opinion on Monday or in two weeks :)

The KWEB story

File this under oh well. I first had this idea in December 2016, thinking USA tech might be weaker due to Trump concerns (wrong!) and then money would to international as replacement (kinda right).

At the time I said not a trade rec since the pivotal perspective was that QQQ was stronger. It is true that QQQ recovered all pivots early in 2017 and KWEB did not do so for good until 1/23.

KWEB weekly bars vs QQQ (red line) from 2014 - terrible.

22 50 KWEB vs QQQ W.png

From 2015 however, returns are about the same with pockets of out-performance and under-performance mostly due to China market.

22 51 KWEB vs QQQ W.png

Since July 2016, KWEB has had two periods of outperforming QQQ, but dropped more in late October and then again after the election into year end. 

22 52 KWEB vs QQQ D.png

Now look at KWEB vs QQQ in 2017 only. That's amazing. KWEB nearly double the gains of QQQ, and QQQ has about doubled SPY thus far. Too bad not spotted earlier for portfolio.

Safe havens

Sum
Several safe havens are at interesting levels and will be part of the tell going forward. These confirmed trouble early in the quarter with VIX and TLT both moving above Q2Ps and GLD was already above all pivots. But VIX stopped bang on 1HP, and TLT highest daily RSI in months looks like a top near Q2R1 & AprR2 areas. AGG is also something to watch, testing YP and 1HP levels.

Bottom line levels to watch:
VIX, TLT, AGG and GLD Q2R1s (all nearby), along with AGG YP / 1HP
XIV Q2P

VIX
Weekly chart down from 1HP, but did not fully reverse the high bar. Hm.
Daily chart jump above Q2P and fast move to 1HP which held it; now resistance at Q2R1 as well.
Daily MA chart some support near rising D20 and below that rising D50 near Q2P.
VIX sum - VIX daily RSI overbought near pivot resistance or the days of rejections of pivots have been among the best stock buys of the last several years. However, VIX still above Q2P and AprP.
 

22 30 VIX W.png
22 31 VIX D.png
22 32 VIX D.png
22 33 VIX D.png

XIV
Weekly rejection of YR2, and still resistance at 1HR2.
Daily charts 2 breaks and 2 recoveries of Q2P.

22 34 XIV W.png
22 35 XIV D.png
22 36 XIV D.png

TLT
Weekly chart near tag of YP / 1HP pivot area.
These levels look further away on daily charts.
Above Q2P and AprP continued up to Q2R1, and so far only 2 trading days above that level. 
TLT sum - daily RSI highest in months, rally to Q2R1 area and AprR2, plus weekly BBs, has potential to be a key top. 

22 39 TLT D.png

AGG
Also rallied to test YP / 1HP area.

GLD
Strong since mid March with hold of YP 1HP.
Daily chart also running into Q2R1.
Later March under D200 was not dropping, then jumped above. 

22 41 GLD W.png
22 42 GLD D.png
22 43 GLD D.png

GDX
Not matching GLD structurally this year. Under D200, and already back under 1HP.

22 44 GDX D.png

USA main indexes

Sum
Positive action on USA indexes last week as SPY, DIA, IWM and VTI all recovered Q2Ps as leader QQQ back above all pivots. But not as strong as it could be, with SPY, DIA and VTI below AprPs. NYA is the one non confirming index, still below Q2P.

Charts
Cash index weekly charts with long term levels only
Daily ETF chart with long term & medium term pivots
Futures current contract pivots only (no S/R) and MAs for clarity of entries (now June 17 M)
Futures "1" continuous contract with Bollinger bands

SPX / SPY / ESM / ES1
SPX weekly top on 1HR2 and low on 1HR1. Last week's bar doesn't look like the best upwards reversal.
SPY held Q2P, still resistance at AprP
ESM shows some resistance at rising D50
ES1 chart two recent lows in March and April both pivot & BB combo areas.
SPX set sum - Q2Ps held in convincing fashion, but still some trouble to clear AprPs.

22 7 ES1 D.png

NDX / QQQ / NQM / NQ1
NDX powering up above 1HR2
QQQ only 6 trading days below its monthly, then back above all pivots
NQM held D50
NQ1 only a couple recent tags of lower BB and fast move back to highs
NDX sum - Wow, D50 held and already back above all pivots.
 

22 9 QQQ D.png
22 10 NQM D.png

INDU / DIA / YMM / YM1
INDU doesn't look good with small up bar below 1HR1.
DIA two recoveries of Q2P though
YM below is falling 20MA as immediate resistance
INDU sum - two recoveries of Q2Ps, but below 1HR1 and falling D20MA makes this weaker than SPX.

22 13 DIA D.png
22 14 YMM D.png
22 15 YM1 D.png

RUT
Weekly chart still between levels.
Daily chart back above all pivots for the first time since April. This time it is after tagging Q2S1 on futures charts and rising moving averages  helping out.
RUT sum - back above all pivots! 

22 17 IWM D.png
22 18 RJM D.png
22 19 RJ1 D.png

NYA / VTI
NYA trouble at 1HR1 and did not clear Q2P.
VTI above both. 

22 20 NYA W.png
22 23 VTI D.png

Valuation and fundamentals

Every week, I check the 12 month forward P/E of SPX as reported by Thomson Reuters. Dividing by price gives the implied earnings estimate. Multiplying by P/E ratios gives theoretical valuation support and resistance levels.

The 10 period moving average of earnings estimates continues to flatten after climbing rapidly last year. 

Multiplying this by 18x gives theoretically SPX valuation resistance - same slope as above.

And here's how this idea played out with 18 P/E (10 period MA of that to be precise) in blue and SPX price in orange. Note: not a hindsight exercise. I pointed to 18x target since summer 2016, and as the market ran into this level expected some professional selling. 

s3.PNG

*

Citigroup Economic Surprise Index took a sharp dive back to the neutral line. There is no positive spin on this chart. 

Valuation score - 0
Fundamentals - 0

I does not appear that the market "should" move anywhere - EU politics and USA taxes seem to be the immediate drivers.

What about French election risk?

This may be part of the Q2 safe haven bid.

GLD above all pivots since 3/21
VIX above Q2P since 4/5; but 1HP tested and rejected 4/12-17
TLT above Q2P
AGG above YP and thus above all pivots; but faded back under YP 4/20

But I think currency is telling the story here. Euro is in the middle of its range for 2017. It is below its YP and 2HP, but above its Q2P and still above AprP. DXY is weaker by comparison, closer to lows of the year. 

EUR D below - is this about to collapse? Red line is 3/2015 low fwiw. 


According to betting odds, Le Pen is widely expected to advance to second round but not to win. An outright win, or market pricing in higher odds of winning, would likely result in:

risk off, safe havens bid
DXY up
EEMs trade slammed as initial move
GLD up

Probably EEMs would drop more than DXY would rally. GLD is doing very well but real buy was weeks ago. One could be less long but I don't think this is correct given the move in markets yesterday. Sometimes one has to deal with ugly gap. If you don't play every time there is a worry, there will never be a good entry. That said someone with more concern of preservation rather than gain could consider May EEM puts, especially if currently overweight on global indexes as portfolio currently is doing. 

How to beat the market

When I was a strategist at a small fund in 2013 with top of the world returns (one of two funds 110% gain, #3 i believe), a lot the performance came from just two stocks. They were immense winners, and the head trader had the experience and fortitude to hold them the whole way - on leverage. 

Modern portfolio theory might dismiss this as too risky and not diversified enough, but actually the latest research shows - the way to beat the market is heavy concentration in what is going up. It sounds obvious, and to some extent it is, but if it was easy everyone would be doing it already right?

Here's the piece on Bloomberg. "The implication, like it or not, is that a concentration of outsize gains in a minority of index members is tantamount to a death sentence for anyone who gets paid for beating a benchmark." 

Or to put it another way - most gains in the index are the results of just a few stocks, so anyone owning more than those few stocks in more equal weightings lags the benchmark. 

The solution is to relentlessly focus and concentrate upon what is performing the best, regardless of any other factor. Other "factor" here means P/E, value, market cap, revenues, margins, growth, story, blah blah blah etc etc etc. The only thing that matters is what is going UP. Only the study of price action gives any strategy in this regard. 

Key point, by up I don't just momentum, or up by percentage terms for the past 12 months, as the academics like to define it. That only tells you went up last year. Give me a break.

If The Pivotal Perspective can work this well across major index ETFs, how would it do across selecting the top 3 on Dow30, top 50 in SPX, top 10 NDX, or similar idea? Actually I never like rigid rules like this - sometimes it could be appropriate to own 10 Dow stocks, and sometimes 0 or 1. But still the point remains - the very best strategy would be to own the best stocks in the best index, on leverage when conditions support - with hedging on index futures when appropriate. 

In this regard, I have only presented the bare outlines of what is possible here. 


Above all pivots?

The list is very slim.

INDA
EEM

yup, in stock indexes, that is IT!

GLD
GDX
AGG! That is the ETF on the benchmark Bloomberg Barclays Aggregate Index

And as long as I am checking out other bond ETFs, then:
LQD Investment grade corporates
HYG, by a tiny bit
HYS, high yield short duration
MUB, muni bond ETF
CIU, intermediate duration beat AGG to the punch

Wow!

I don't think too many people expected this at the beginning of 2017, only 1.5 quarters ago. 

Key point: USA main index leader QQQ is not far from recovering this status too. This needs to happen for a bullish scenario for stocks.