Sum
All USA main indexes are above all pivots, and all but IWM is above all MAs (IWM above all except 10MA). This is very bullish configuration and the trend gets the benefit of the doubt.
But leader QQQ is nearing YR2 and SPY YR1, so this means test of significant resistance is likely ahead. Also, on SPY, RSI approaching 70 area on both weekly and daily charts for SPY (RSI already 70+ on monthly and quarterly charts). So yearly levels are worth watching for a potential top, but anything above that sustains would be very bullish.
Charts
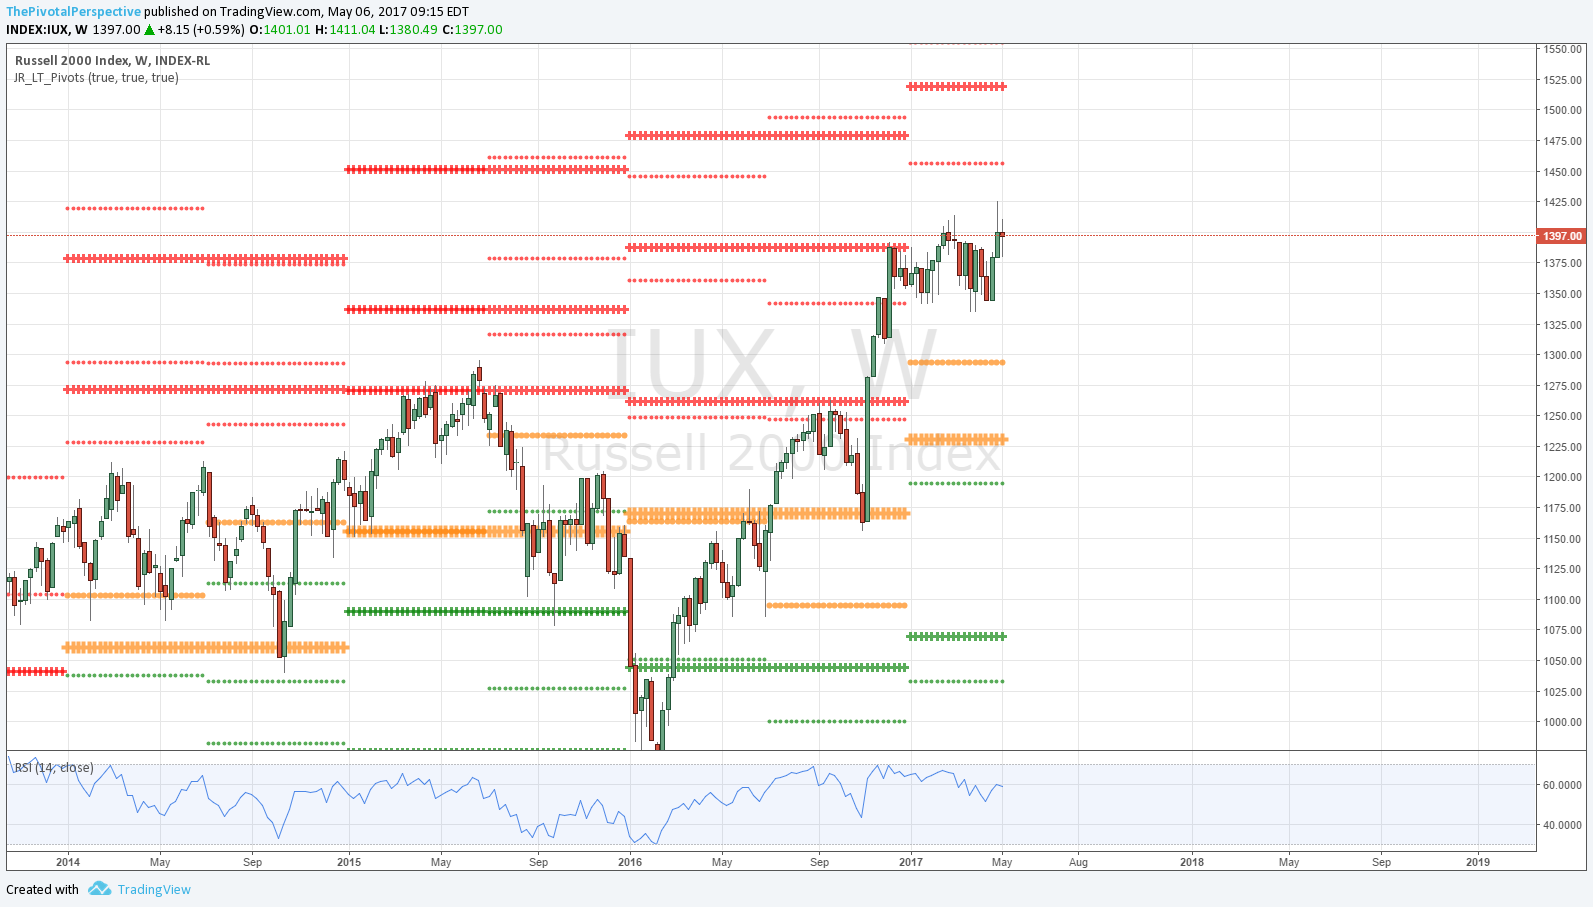
Cash index weekly charts with long term levels only
Daily ETF chart with long term & medium term pivots
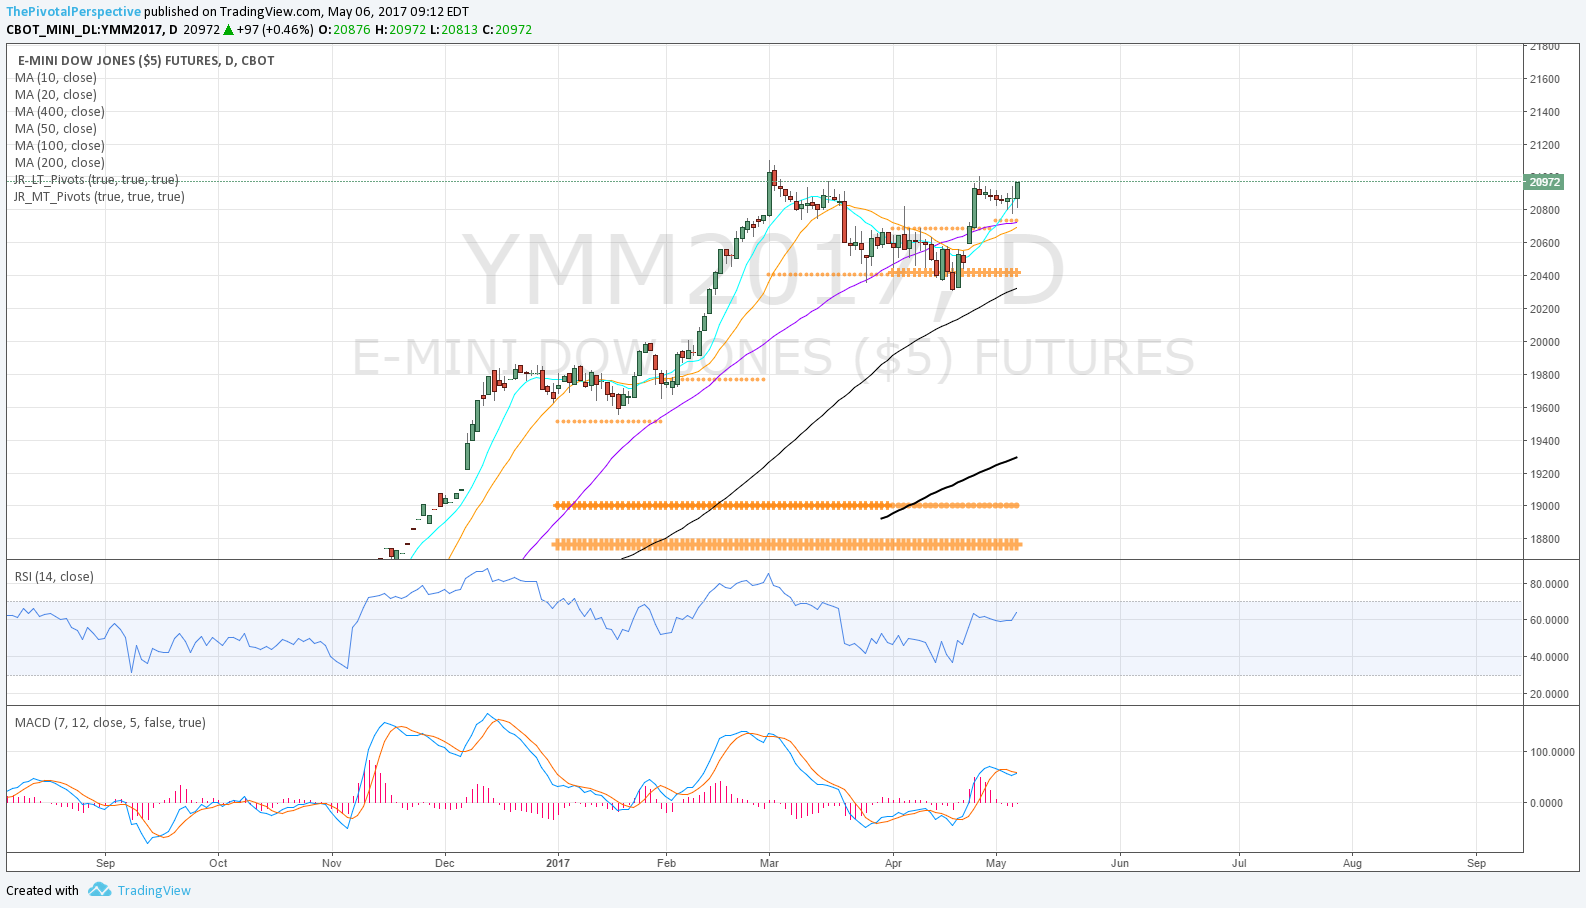
Futures current contract pivots only (no S/R) and MAs for clarity of entries (now June 17 M)
Futures "1" continuous contract with Bollinger bands
SPX / SPY / ESM / ES1
SPX weekly approaching long term resistance area of the 1HR2 & YR1 2400-2407. Positive to clear the previous weekly close high in the solid red line. Also note RSI at 68.2 approaching 70 level, possibly setting up divergence top.
SPY right at the 3/1 close high. YR1 & 1HR2 a bit further out at 240.90.
ESM nothing wrong with this chart, nice hold of Q2P, recovery of MAs and heading up.
ES1 shows above 3/1 close high and heading into YR1 at 2403.
SPX set - Approaching YR1 / 1HR2 resistance area. Daily charts above all pivots and MAs is bullish; daily and weekly RSIs getting up there and worth watching 70 area tags if higher Monday.
NDX / QQQ / NQM / NQ1
NDX W heading to YR2 at 5684.
QQQ brief dip below AprP, recovery and another rocket up from there.
NQ huge hold of D50MA.
NQ1 chart shows YR2 a bit higher than cash index probably due to 11/8/2016 influence.
INDU / DIA / YMM / YM1
INDU long term resistance a bit further away.
Daily charts doing fine with hold of MayP and up. AprR1s doable.
RUT / IWM / RJM / RJ1
Weekly chart also further away from levels.
Daily chart above pivots, but further from 3/1 high. So far Q2R1 is the top. Also, compared to QQQ move after 4/20 this has been very dissapointing.
NYA & VTI
NYA above 2HR1 looking good.
Daily chart nice hold of MayP and UP. AprR1 doable and maybe Q2R1 above that.
VTI similar, again at 3/1 close high but looks ready to get through.


