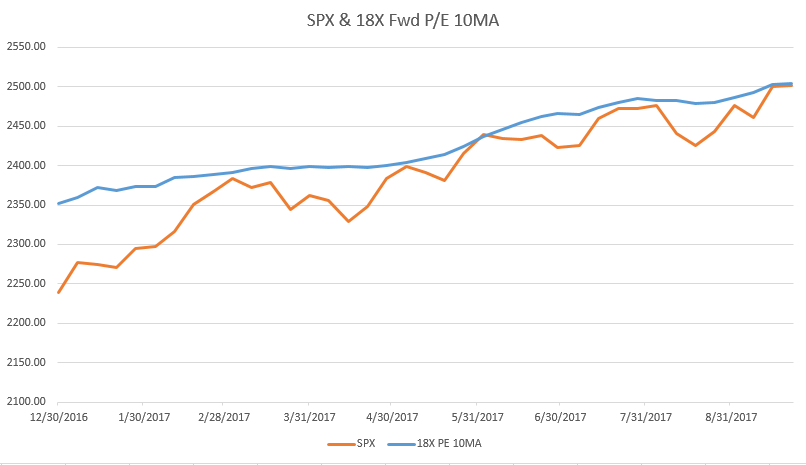
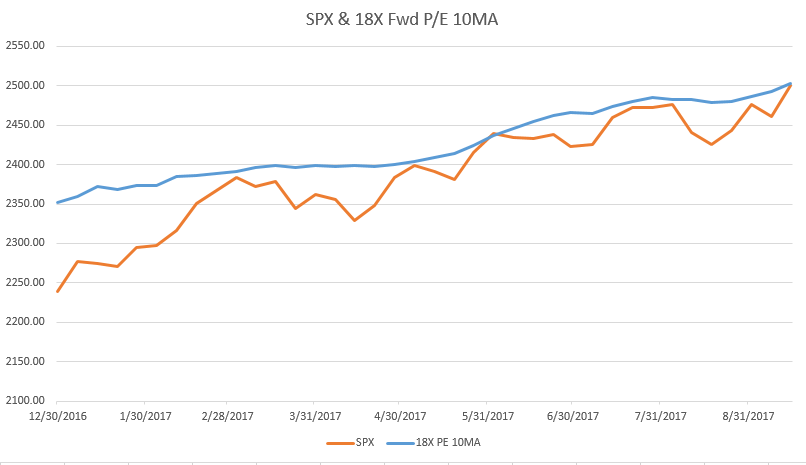
SPX continues to launch above 18X forward earnings on both real time and moving average basis. Moving average in blue below, SPX in orange.
Bond yields and $DXY should be rallying with this move on Citigroup Economic Surprise Index.
Your Custom Text Here
SPX continues to launch above 18X forward earnings on both real time and moving average basis. Moving average in blue below, SPX in orange.

Bond yields and $DXY should be rallying with this move on Citigroup Economic Surprise Index.

SPX (orange) launching above 18X forward earnings 10 week average (blue).

Citigroup Economic Surprise Index continuing up.

SPX (orange) Continuing above 18X forward earnings (blue) on real time and moving average basis - here's the 10 week average of 18X valuation level with SPX now above.

Citigroup Economic Surprise Index favoring $DXY and yields.

SPX continues to trade above 18X earnings, on both 10 period moving average basis shown in graph below and the weekly number from Thomson Reuters.

$DXY moves no surprise to anyone following the Citigroup Economic Surprise Index.

SPX continues its launch above 18X forward earnings, both on real time and 10 week moving average basis.

Here's my record of week by week Thomson Reuters data from 2017 2H:
17.78
17.59
17.67
17.93
17.95
17.78
17.75
17.72
17.54
17.64
17.57
17.81
17.92
17.89
17.97
18.10
18.11
And here is the Citigroup Economic Surprise Index. No wonder $DXY rallied!

From the week of 9/29 on (ie Q4 to keep it simple), SPX price has been lifting above the 10 period weekly moving average of 18X forward earnings. I considered this significant because this valuation level acted as a cap at several points earlier this year. The launch continues.
This data is coming from Thomson Reuters, and each week I write down their current SPX forward P/E. Up to last week, this also had approached but not exceeded 18; and the latest reading is 18.1.
My conclusion is that institutions are not selling into valuation concerns because the market is believing in the corporate tax cut which will slice the current multiple.

From 2H (first half looks similar, just more time 17-17.49 zone) weekly reading:
17.74
17.78
17.59
17.67
17.93
17.95
17.78
17.75
17.72
17.54
17.64
17.57
17.81
17.92
17.89
17.97
18.10
FWIW FAANG equal weight P/E is 57.30, down a bit from last week.
Citigroup Economic Surprise not sustaining recent positive momentum.

Wow - the first weekly close above the 10 period moving average of 18X forward P/E. Valuation in blue, SPX weekly close price in orange. Data shows this year but it goes far beyond that.

Here's a weekly version from Ed Yardeni that goes back further. His 18X is a bit higher; he is using last week's number (due to reporting lag I suspect), which may be higher than my current 10MA.

In case you are curious here's the monthly version. The point here is that SPX rallied above 20X valuation only in 1998-2000. The 1987 peak was at 15X earnings. LOL, now that seems cheap!

FAANG equal weight P/E again 55.
Citigroup Economic Surprise Index cannot really get it going. This would help interest rates and $USD to rally further.

10 week average of SPX 18X forward P/E in blue; SPX price in orange (weekly closes). Once again, tagging - but not exceeding - 18X.

FAANG equal weight forward P/E (new pet project) 55, not much change from last week.
Citigroup Economic Surprise not quite getting into positive territory - better chance for $USD and bond yields to rally should this occur.

SPX price (orange) rallied back to the rising 18X valuation level (blue).

FAANG Fwd P/E 52s in August, up to 55 now.
Citigroup Economic Surprise Index almost going back positive. USA stocks have shrugged off months of weakness, which means international versions likely looked much better. $USD and bond yields have not ignored this chart, with $DXY and $TNX lows for the year in September.

Once again, pro selling at SPX 18X forward earnings. I am using a 10 week moving average to smooth out week to week noise, but this idea is working pretty well per chart below. Valuation level moving average in blue, SPX weekly close price in orange. The one positive is returning back to positive slope after a few negative weeks, which allows price to potentially return to the same valuation at higher prices should that trend continue.

New pet project: FAANG equal weight forward P/E 54.7, up fractionally from last week.
Citigroup Economic Surprise Index off lows, but still in negative territory since the end of April.

18X forward earnings represented by its 10 week moving average has been near the top on several weeks. After declining in value in weeks prior, last week showed a healthy rebound as price advanced. Current level 2486.

Citigroup Economic Surprise Index improving, but still a long stretch in negative territory.

FWIW FAANG equal weight forward PE from 52.3 to 54.3 last week.
10 week moving average of 18x forward earnings (blue line below) was essentially the high area, that capped SPX price (orange) on several tests.

New idea - forward P/E for equal weight FAANG. Currently 52 and that is off the highs.
Citigroup Economic Surprise Index may not seem to be heavily influencing stocks, but it is certainly impacting bonds and currencies.

Professional smart money has sold SPX at 18x forward earnings. I have been pointing to this valuation level for many months. As long as it was rising in slope, I argued that the market may still face resistance yet continue to go higher as the level went up as well. Last week was a drop in the moving average of forward earnings - not totally rare, but according to last week's notes, "more resistance at this level, currently 2483."
It would be interesting to see buyers either at 17.5X currently 2413 of better 17X 2344.

Citigroup Economic Surprise Index is up from low levels. DXY has stopped going down but that is about it.

I use a 10 period moving average to smooth out the week to week noise in the SPX 18X forward P/E, and this week it took a notable drop. Since 2016 Q4, this hasn't happened too often, less than 20% of the time. The important thing for positioning is that downward revisions to forward earnings should mean more resistance at this level, currently 2483.
It has been very clear from the image below that a big fund has been trimming each time SPX has reached up to 18X forward earnings. There hasn't been one weekly close above, with several tests and reactions lower.

It is clear from the moves of 2017 that the Citigroup Economic Surprise Index had more pronounced effect on currency moves and bonds than stocks - but this could be a late cycle aberration. When at a small hedge fund I tracked the versions for China, Japan, Emerging markets, and Europe and they did very well in anticipating relative leaders most of the time.
So, improvement from very low level may help stabilize $USD for a while.

This past week SPX again bumped up against forward 18X P/E, or more accurately, the 10 week moving average of 18X P/E, and turned lower. These are weekly close figures so even though this past week look like it was a little shy, consider the value was 2480 last week and 2485 this week; and the SPX high was 2484. Someone big is selling up here, although the reactions have been quite mild thus far, this could change.
Also, as long as the slope is decently positive (rising 5 points a week is great!) then I think there won't be serious selling pressure even if this level continues to act as resistance. When the slope rolls over though, watch out for a more serious drop.

Citigroup Economic Surprise Index is turning up from very low level but still.

10 week moving average of 18x forward earnings in blue, and SPX in orange. This chart removes 2016 Q4 data so slope of recent moves more clear. Since May, earnings estimates rising with impressive slope. Price has knocked against this a few times on weekly close but not exceeded. It will take a levelling off of earnings to put real selling pressure on the market. Estimate 3 on scale of -5 to +5.

Citigroup Economic Surprise Index still terrible. It would be interesting to see the global versions, but as far as I know that takes a Bloomberg. Score -4.

Combined estimate:
3x2 (to double weight) = 6
-4
Total 2.
These measures have argued for more tepid equities, but if profits are increasing and fundamentals improving outside the USA, that rather nicely aligns with current markets.
SPX pushed back to the 10 week average of 18x forward earnings, which itself is decently higher than last week. Another level to watch in weeks ahead - clearing 18x may turn the level into support which would be very bullish and open the door to 19x-20x. Scoring this 3 due to increasing earnings on the 10 week average - from 2465 to 2473 in one week is a decent lift.

Citigroup Economic Surprise is still terrible - mild bounce from extreme low levels is right direction. -4.

3*2 = 6
-4
Combined total +2. Stock market is acting stronger than that right now.
From this view, it is clear that SPX reached 18x forward earnings and took a breather. This is a bit less strong than last week since the slope just evened out, with the 10 week moving average dropping slightly.

Meanwhile Economic Surprise ticks up from extreme low levels. Still pretty bad though.

Rough estimate of scoring = 2 for earnings and -4 for valuation. This is a drop in earnings (due to slope of P/E leveling off) and slight increase for fundamentals (due to uptick). Earnings get double weighted so:
2x2 = 4
-4
Combined score = 0 on scale of -15 to +15.
This model has pointed to sideways market for several weeks now, and this is how it has played out. Before double weighting the earnings, fundamentals led to more bearish conclusions in May which did not work as well.
Regular update on 10 week moving average of 18x forward earnings according to Thomson Reuters plotted with SPX price. Healthy that the slope of the P/E is increasing, but you can see SPX bumped up against this valuation a few times and professional sellers have stepped in each occurrence.

Citigroup Economic Surprise Index from Yardeni still looks terrible.

3x2 = 6
-5
Total score +1 on scale of -15 to +15
Markets should be about sideways. I have been saying this for several weeks.
Ten week moving average of SPX forward earnings continues to climb, making 18x that level up to 2462. This is a fully valued market but the upward slope is still a decent positive. Valuation level in blue and in orange in the graph below. Scoring 3.

Citigroup Economic Surprise could not be worse. It looks so bad some smart people have started to think it can only go up from here. Score -5.

3x2 (double weighted) = 6
-5
Total 1 on scale of -15 to 15.
Markets should have limited upside based my reading of these indicators.