E-wave

As I have said many times, I dabble in Elliot wave. There are several drawbacks to this model:

1. Not qualitative enough for today's environment
2. Always an alternative count
3. Lack of clear entry, trade management and exit signals
4. Less emphasis on market leaders - which is where you make the real $

All that said, this model recognized the bullish potential of the lows reached in Q1 2016, and pointed to much higher highs for a final bull market high. On 3/19/2016 with SPX at 2050, I was projecting SPX 2250-2500 to land in 2017Q2 to 2018Q2 - not bad!

From another post on 6/30/2016: "If all this is correct then we are about to get the last best move of the bull market over the next year or two." Nailed it!

Now what? If the concept is unfamiliar to you, please click the tag and check out prior versions. The last update from 3/5 spells out where we are in the model. 

Market is currently in:
W5 of monthly
W3 of weekly, with wave 3 subdivision of larger wave 3 (w3/W3) top on 3/1

w4/W3 is now playing out.

If w4/W3 matches W2, then we will see 2270 area. If w4/W3 matches w2/W3, then it will be 2290. Though I am optimistic for a bounce here, let's say 2270-90 would be a better and more rewarding technical buy. 

16 1 SPX W.png

Take note: if model is correct, the remaining up portions of this bull market are limited to:

w5/W3 on weekly SPX chart
W5 on weekly SPX chart
Finito

Or translation, wherever low forms, up, bigger down, bigger up - then that's it! 


Total market view

REVIEW
4/9 Total market view: "... at the end of last week safe havens perked up in a way that we haven't seen since before the election: VIX closed above a quarterly pivot, XIV closed under a monthly pivot, and TLT also closed above a quarterly pivot. If we ignore 1 day fractional break on XIV, then none of these have happened since before the election. In mid-March GLD tested and held its YP and since then rallied to be above all pivots as well. I think the combined effect of strength in safe havens increases the chances for further declines for stocks, or at least will limit upside."

"Staying long risk with hedges that can quickly be covered, should the warning signals given by safe havens diminish."

Result
USA indexes dropped last week as safe havens continued higher.

SUM
Stocks - USA mains, sectors, & global - have mostly been in rally phase since early November after the election. USA Small caps and financials led in 2016 Q4; and as they have softened in 2017, tech and global stocks have taken over market leadership, making tremendous rallies this year. 

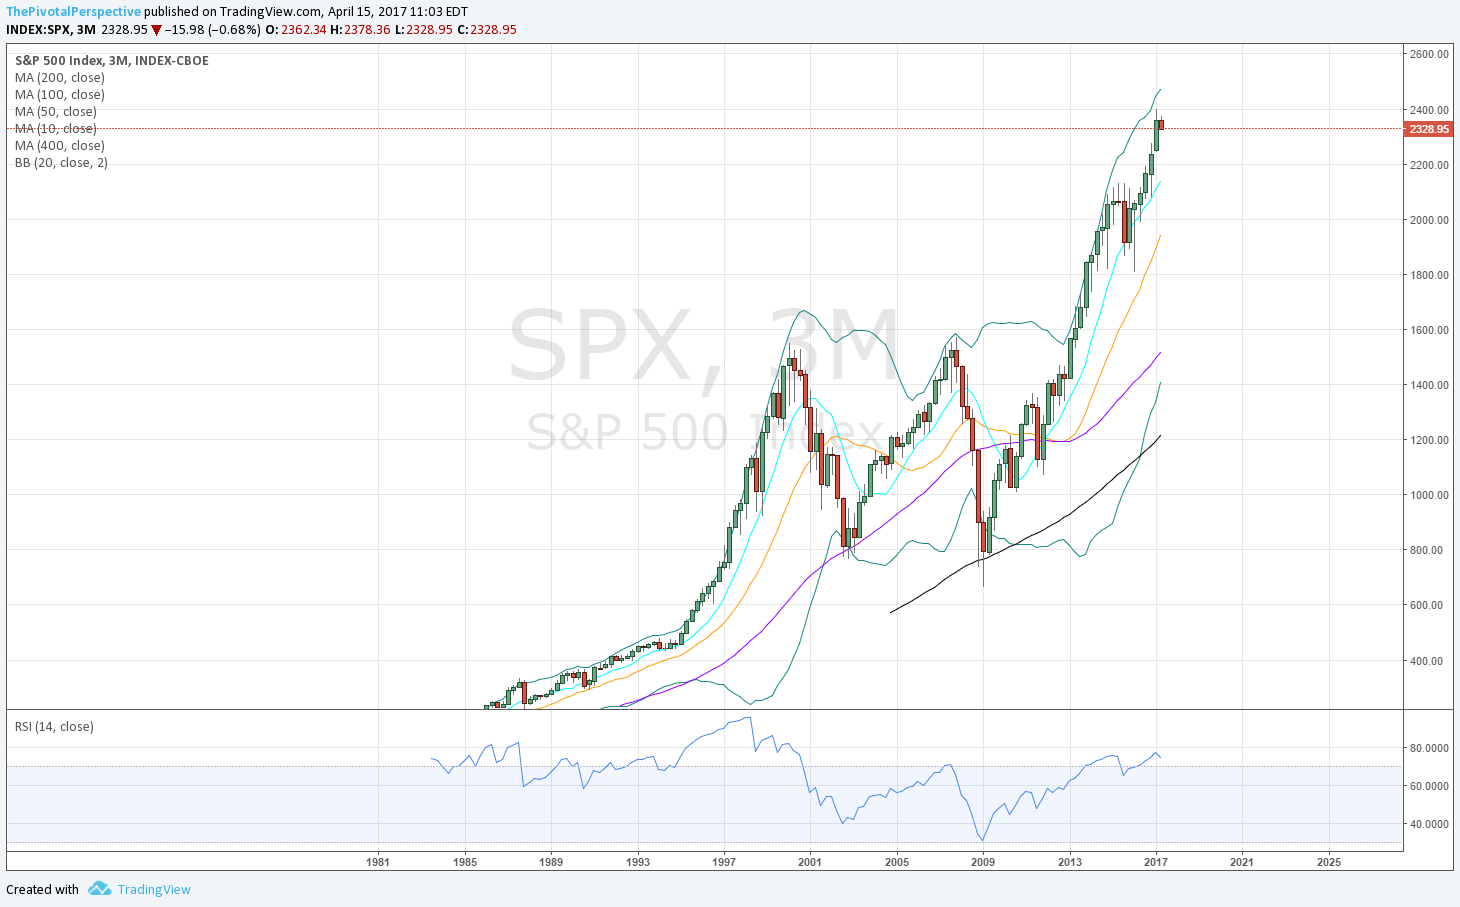
Benchmark SPX rallied 15.2% from 11/4/16 lows to 3/1/17 highs, spanning ~84 trading days. After reaching YR1 and 18x forward earnings, The Pivotal Perspective was that upside would be limited (to SPX or INDU YR1s), and this is exactly what has occurred. On 4/5, I issued a "semi-trouble alert" and reduced long exposure to the lowest it has been since before the election. Most stocks indexes have gone lower since then.

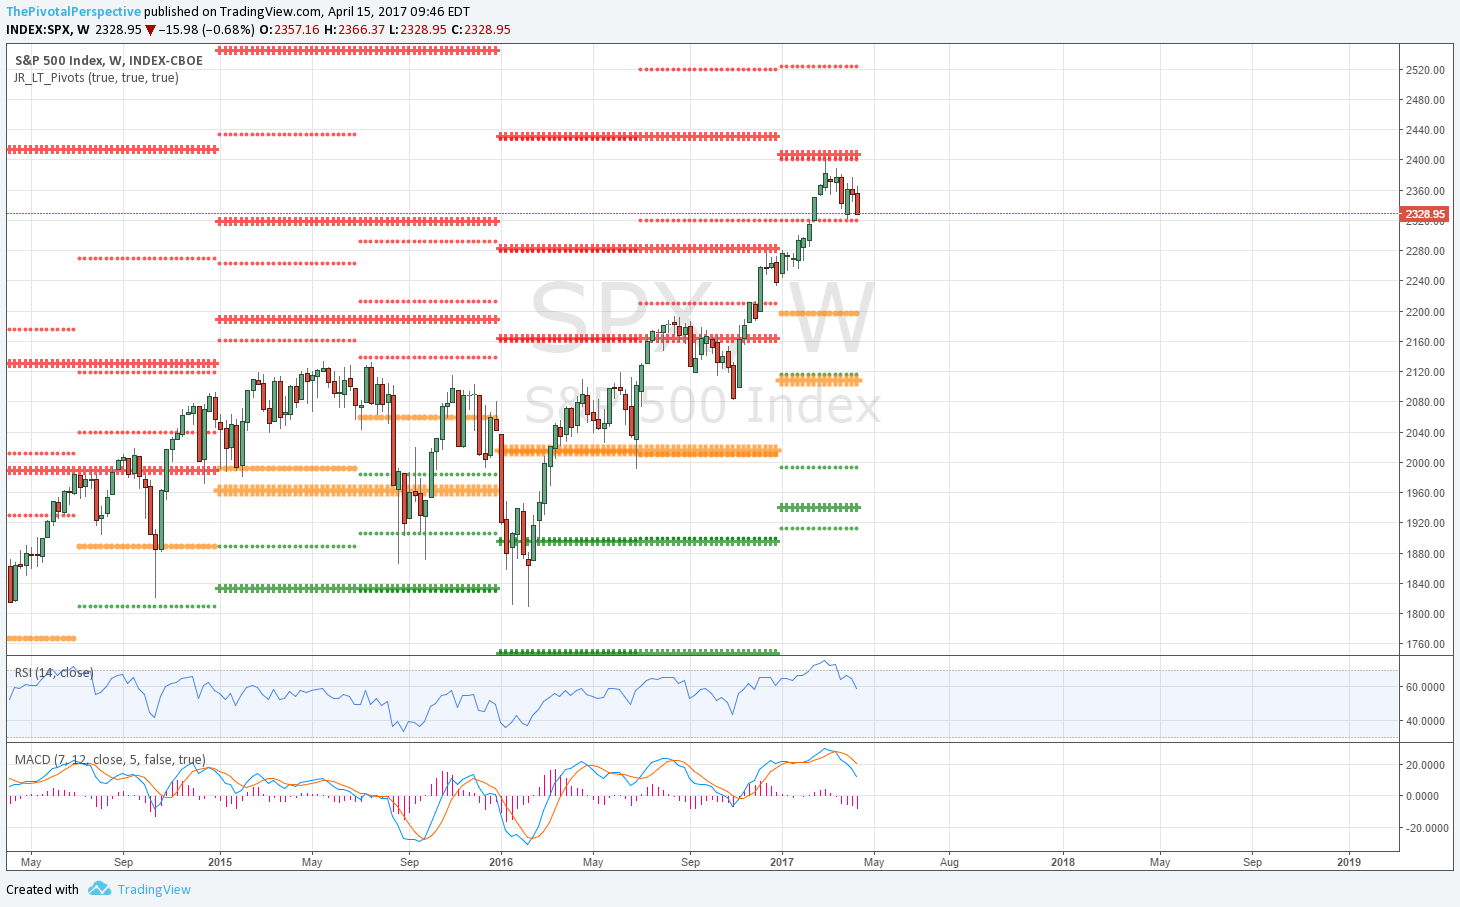
Thus far the correction of -3.2% tick to tick on SPX over 18 trading days has been completely normal. The question is - what now?

Though N Korea worries seem to have ebbed over the weekend, there are still political concerns ahead with the French vote. It is possible that VIX remains elevated, or USA stocks bounce and then fail. It is a week to stay nimble, because a hold here could be one of the better buying opportunities of the year; yet in this environment there is the risk of lower before the bottom that matters. 

Bottom line
VIX closing just under its 1HP of 15.99, and some SPX and INDU variations within striking distance of recovering Q2Ps, make a bounce a possibility. Should this happen with VIX reversing lower from 1HP, the portfolio will return more long, continuing to emphasize what has shown pivotal strength during this pullback. If lower, then I will likely reduce the USA index positions further. 

Positioning
Currently 40% net long, with 4 global longs, and 2 USA longs hedged with 2 weaker IWM shorts. 
Note - from here I will add the safe havens as positioning options since I am looking at them carefully anyway. For example, GLD long 3/15-21 would have been better than any short hedge idea. 

Though I have designed this site for the active ETF investor/trader, there is another way to use levels and that would be on high leverage under certain circumstances - meaning when several of these elements combine to produce a high likelihood of a turn. A fund with nimbleness and leverage could choose to "go big" during these times. A recent example would have been shorting the 3/1 highs with SPX YR1 and valuation levels reached, in addition to several RSI and BB extremes that were not likely to last. Another example could be long this week, if Q2Ps recover and VIX drops from 1HP. 

PIVOTS
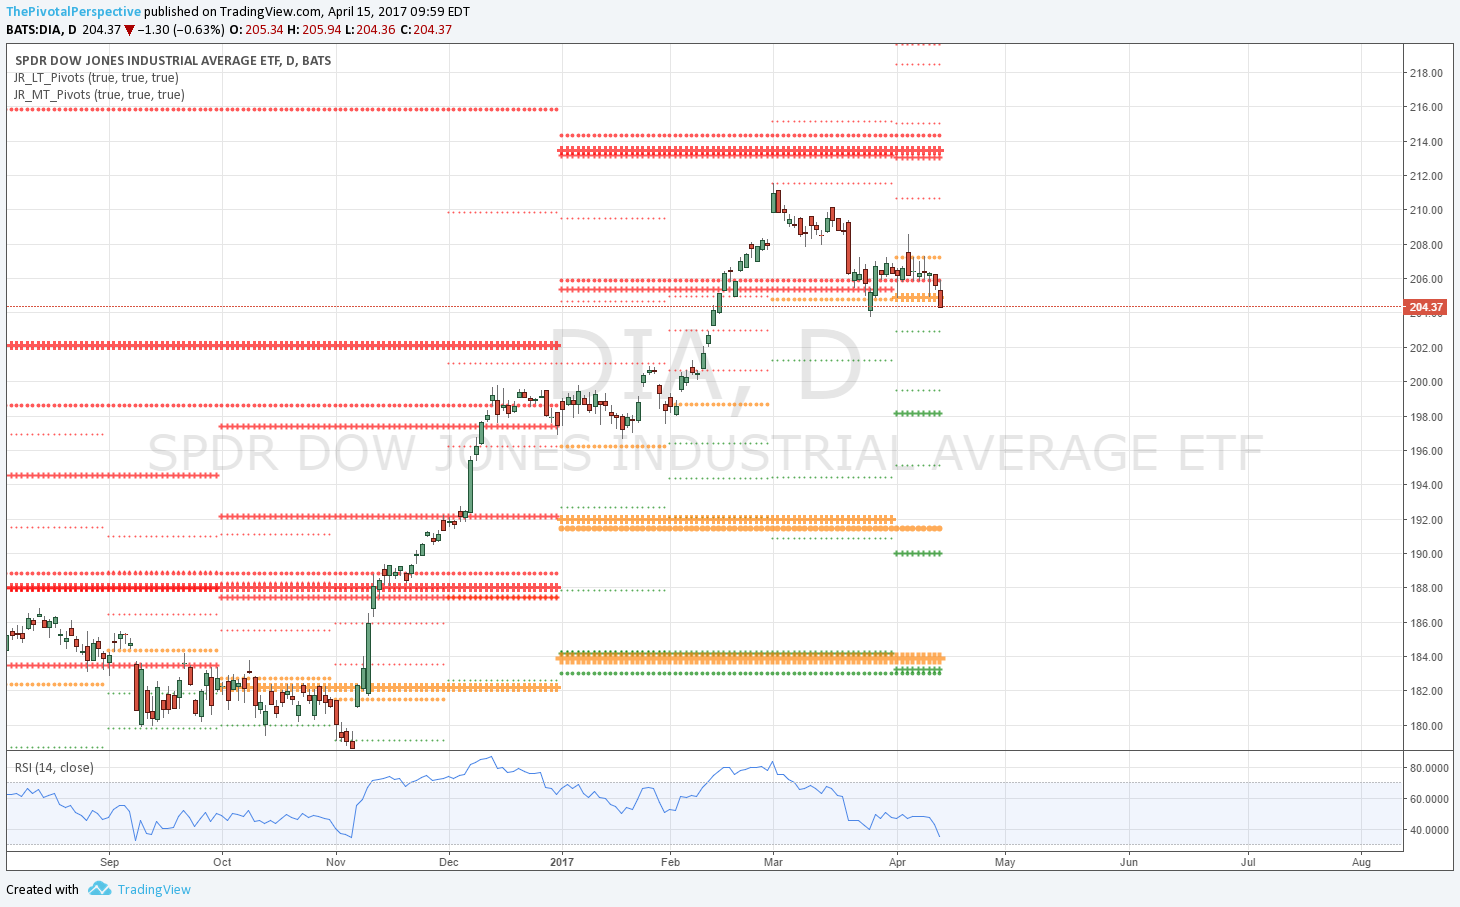
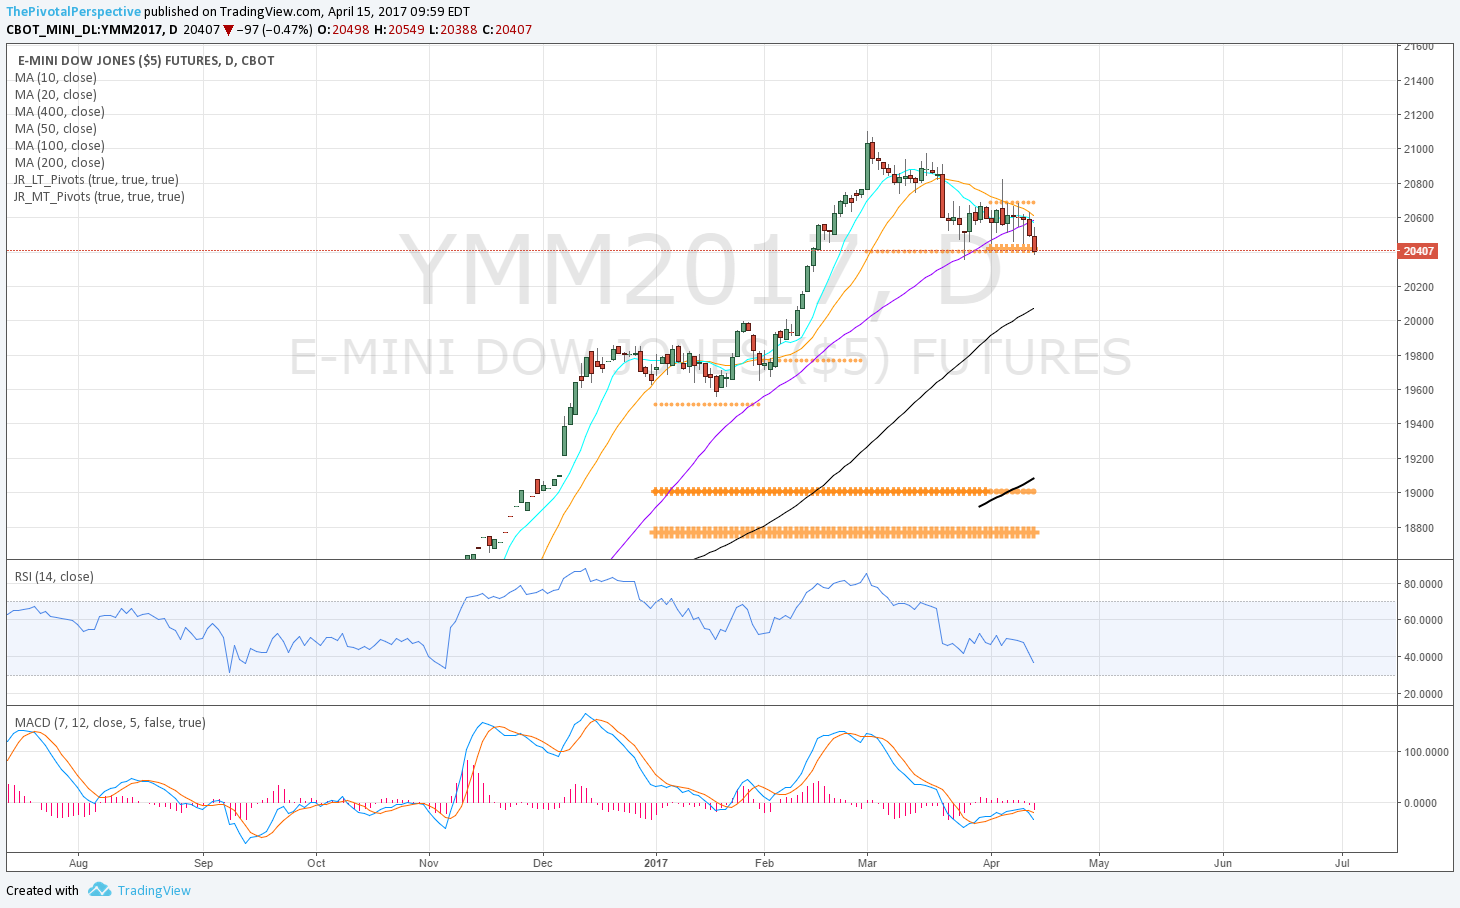
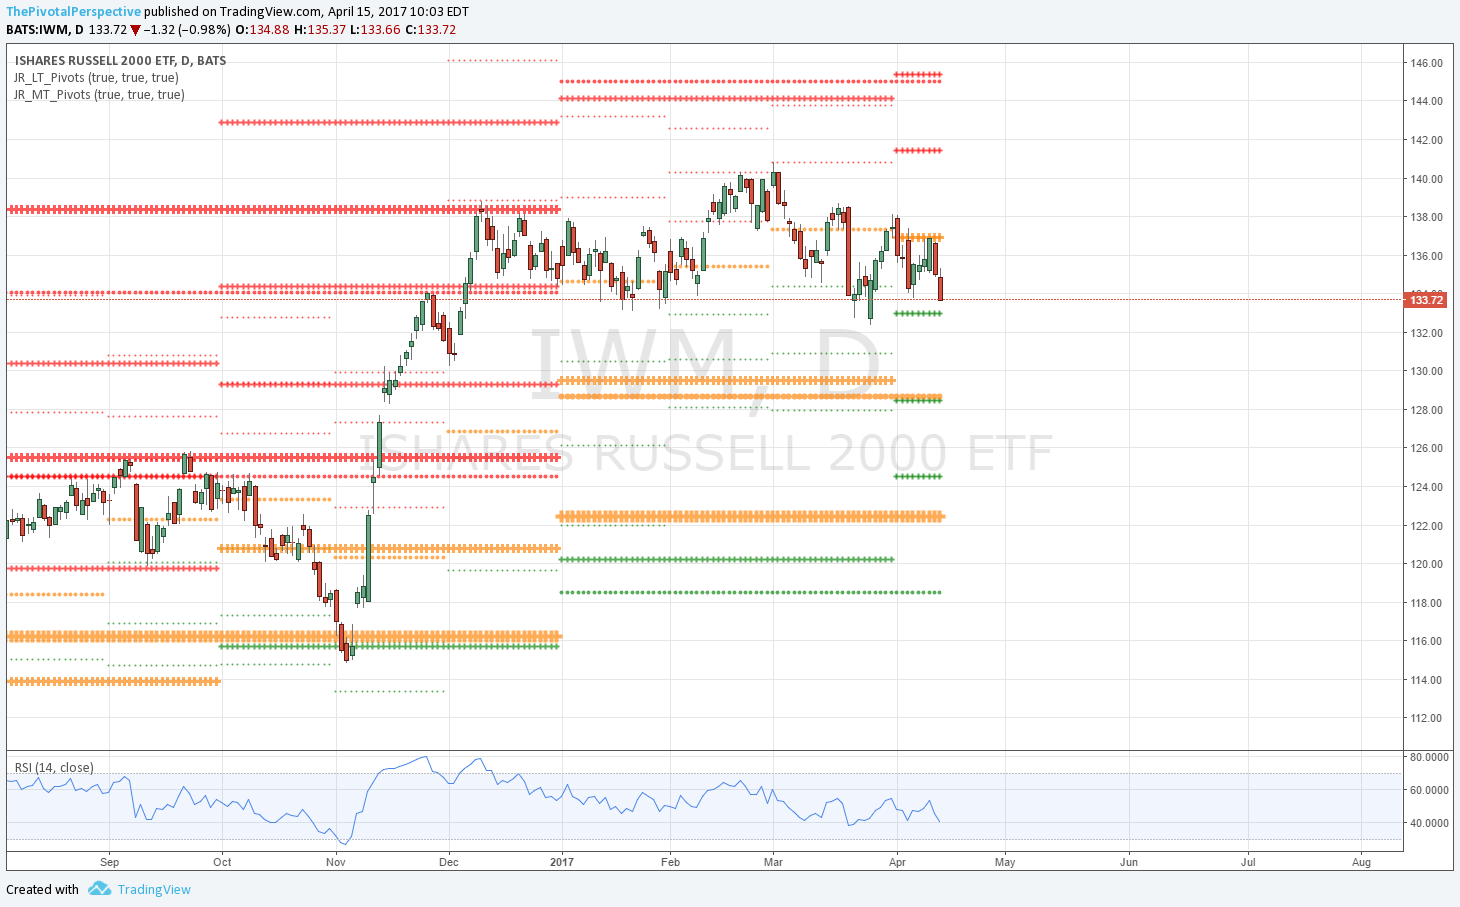
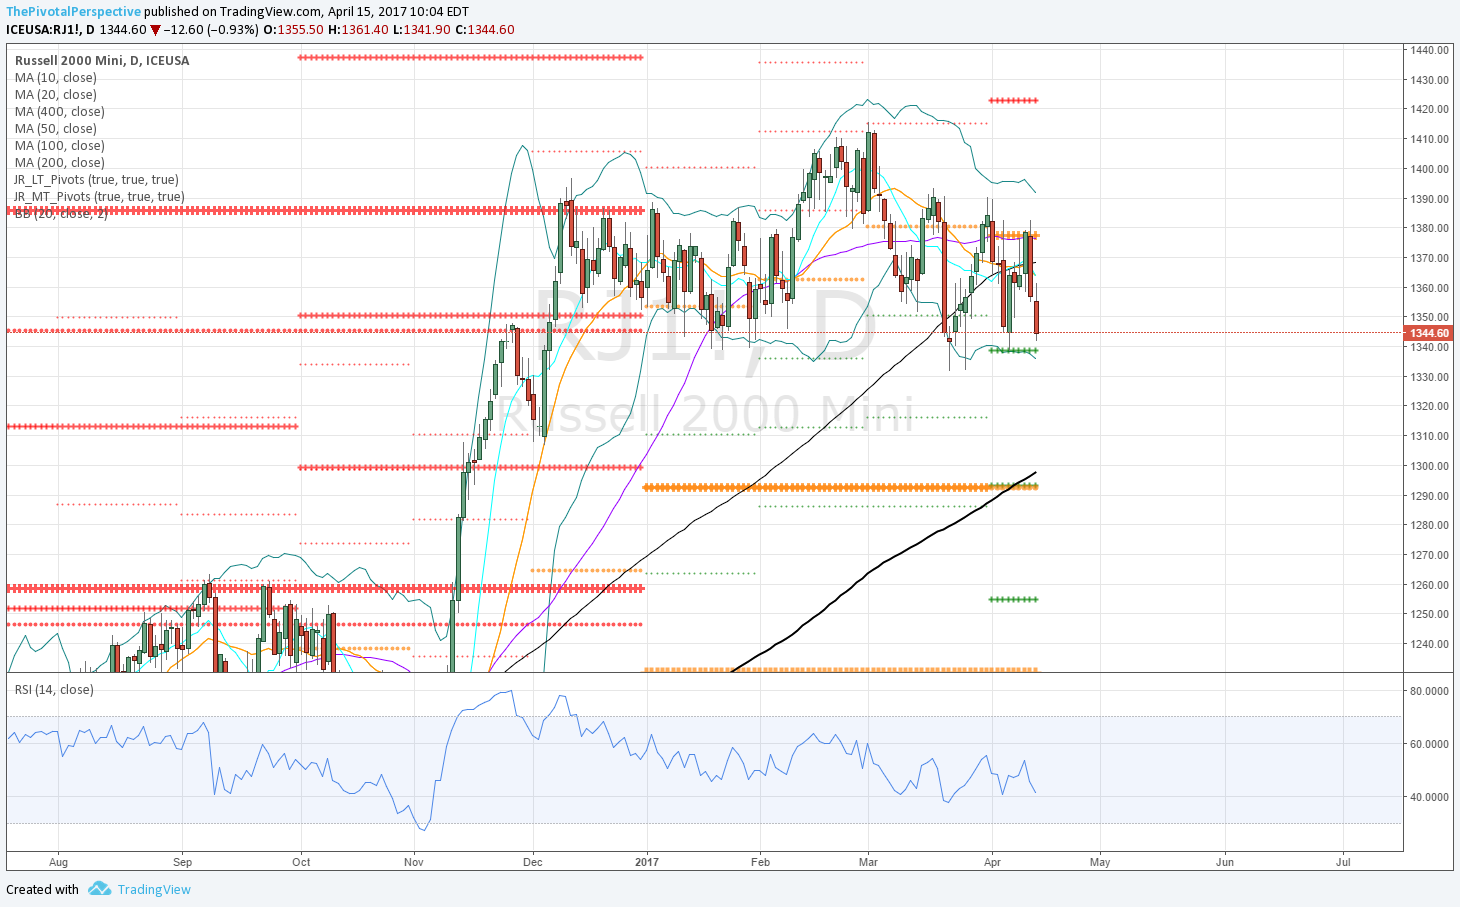
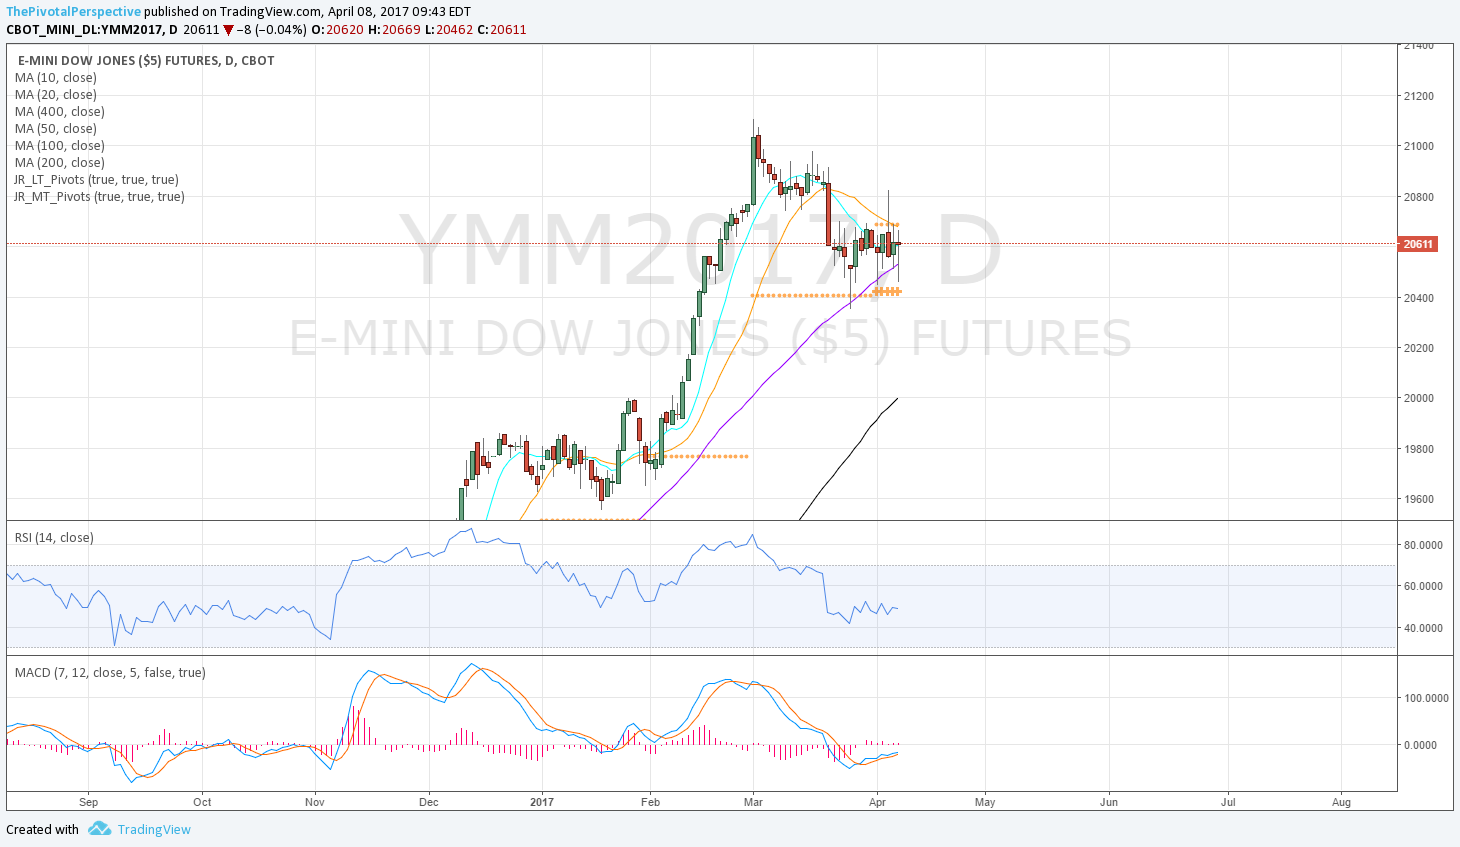
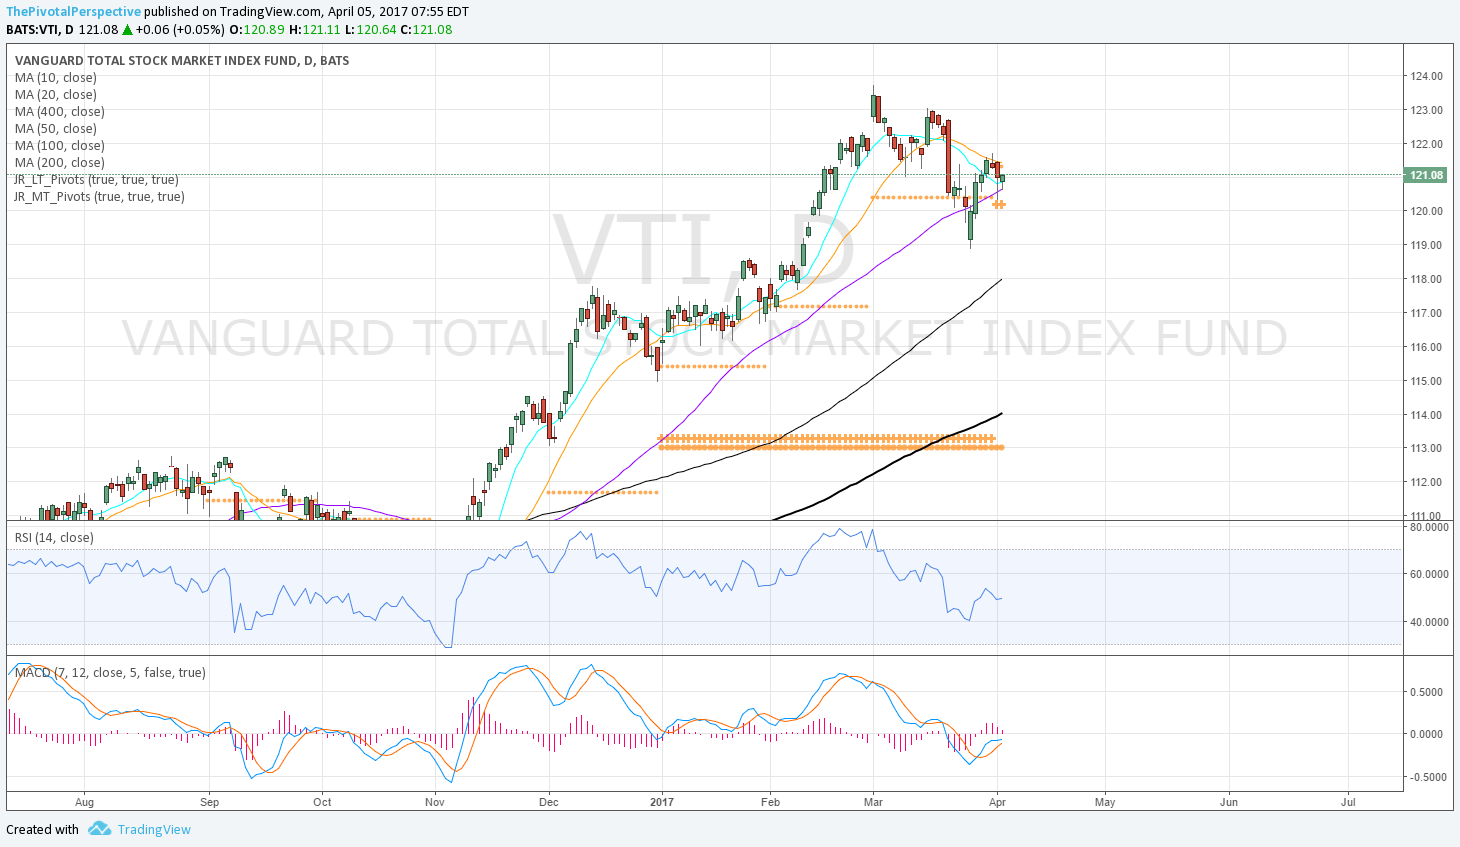
USA main indexes - If lower then watching IWM Q2S1. If recovery then we'd want to see decent liftoffs from Q2Ps on SPY, DIA and VTI.

Safe havens - VIX testing 1HP which I think this will be the key tell. GLD and TLT also on Q2R1s with AGG testing YP. So a lot of safe havens on key levels here. 

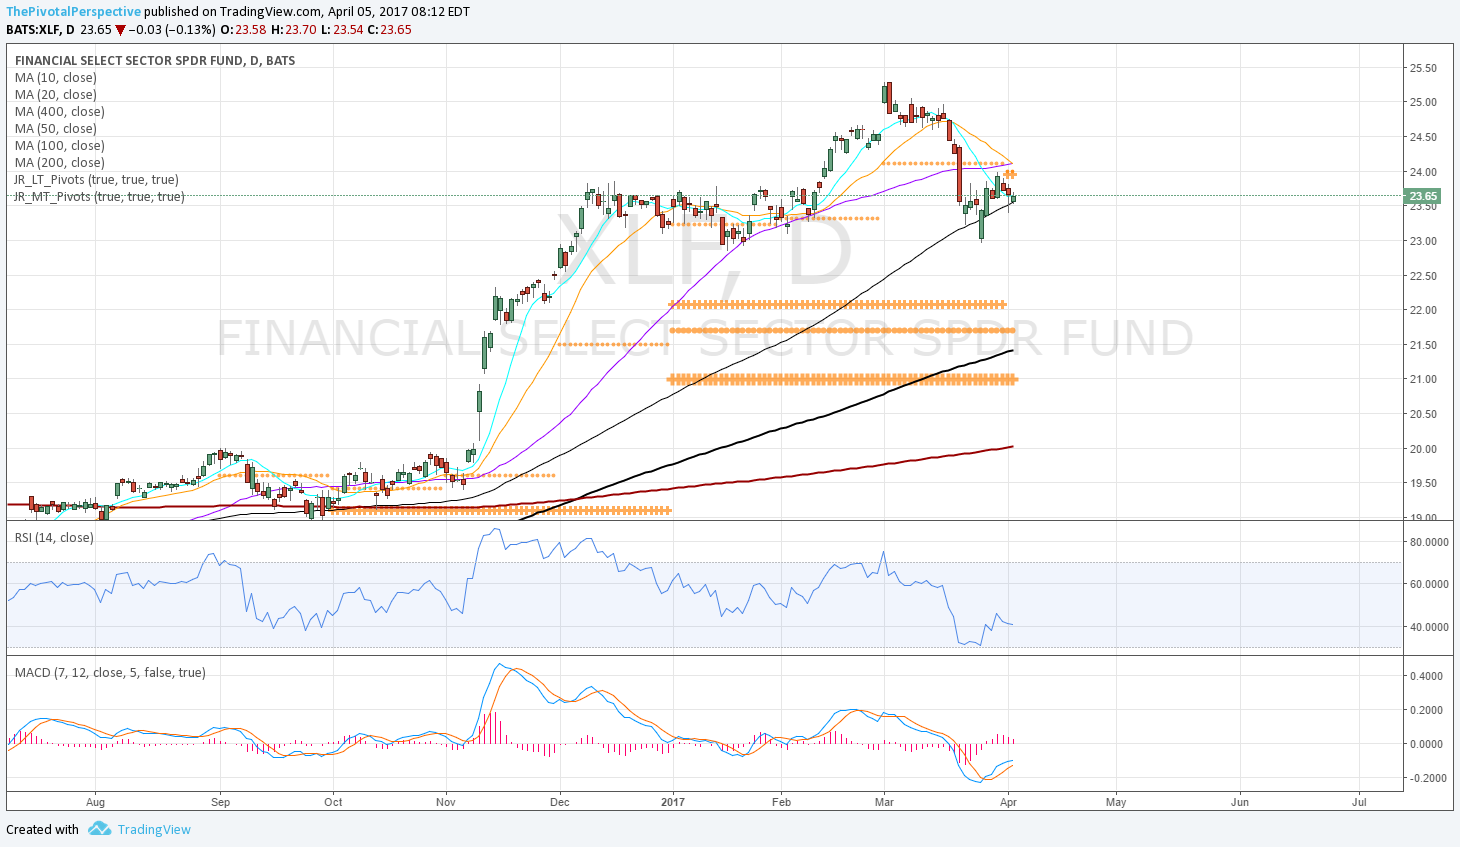
Sectors of interest - Seems like IWM and XLF should reach Q2S1s during session for a low.

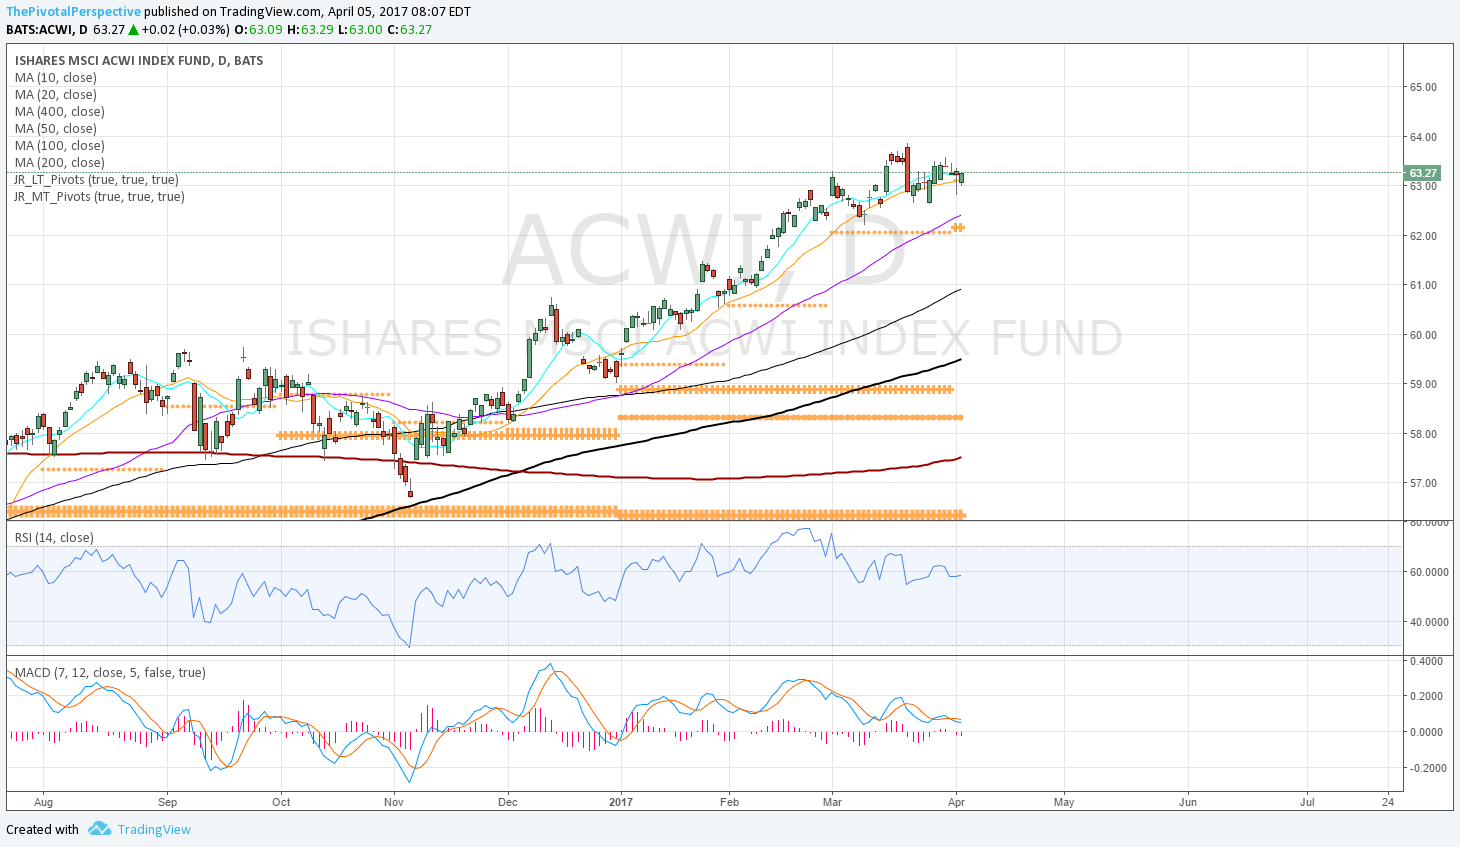
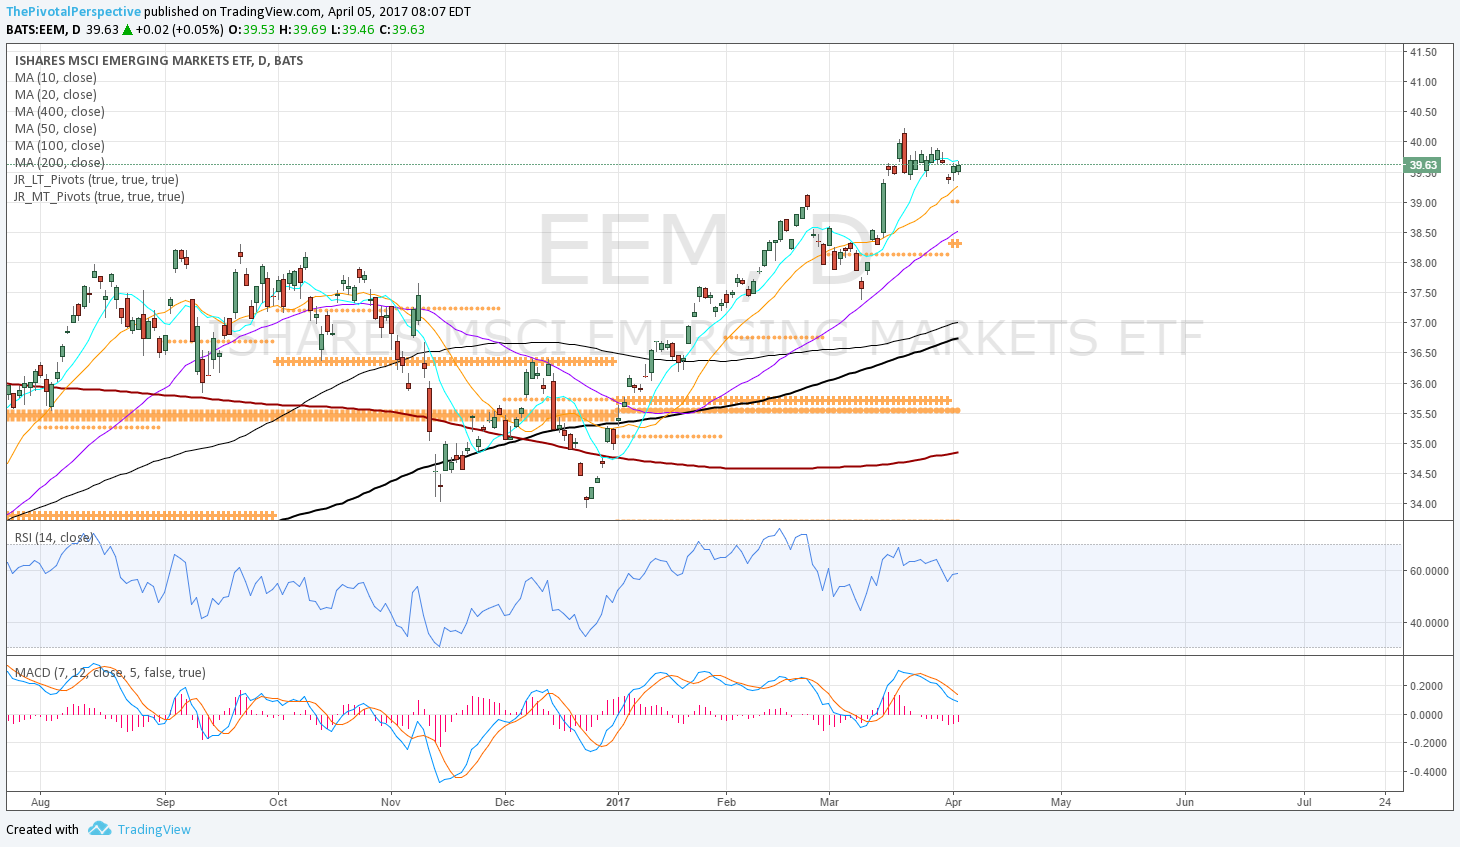
Global stocks - INDA, EEM, and SHComp remain above all pivots. 

Currency & commodity - DXY held YP 3/27-28, then rejected Q2P 4/7-11. DXY above all pivots would likely put global longs more at risk. 
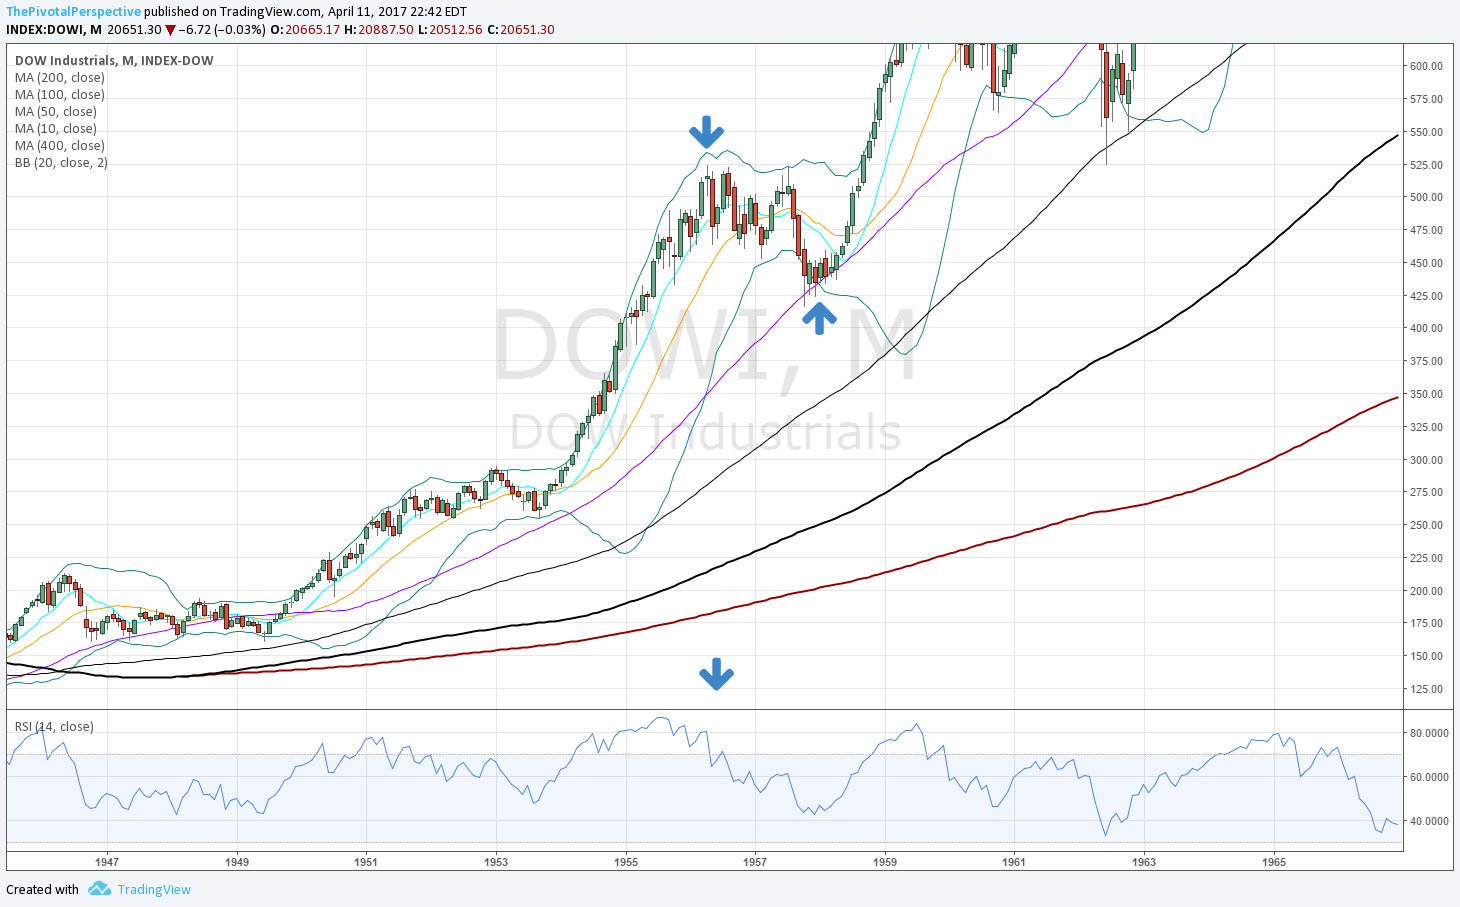
OTHER TECHNICALS
Been a while since risk assets have been down for quarter and month. While I do think there is chance of a bounce this week, it is equally likely that real buying will not begin until indexes are lower. 

VALUATION AND FUNDAMENTALS
18x forward earnings on SPX basically nailed the high. Decline not enough to attract value buyers yet. 

SENTIMENT
Crowd already bearish pn 2 of 4 measures as of 4/6. This tends to limit damage and duration of stock declines and adds possibility to short squeezes. 

TIMING
(Proprietary experimental work in progress model)

April dates
4/6-7 - minor stock low
4/10 - key lower high for USA main indexes
4/19-20 - looks bearish for stocks, positive for safe havens
4/26


Positioning

Came into 4/10 week:

2 DIA (first positions near election with shuffle week of 1/30)
1 QQQ (12/7)
2 SPY (2 on 1/3)
1 SMH (1/18)
2 INDA (3/3 + 3/28)
2 EEM (3/13 + 4/3)

2 EEM short hedges 4/5
2 IWM short hedges 4/5

10 longs, 4 short hedges, 60% net

Adjustments
4/10: None
4/11: None
4/12: -1 SMH, cover EEM short hedges, adding QQQ hedge back on
4/13: -2 SPY, -1 DIA, cover QQQ short hedge

Leaving
1 DIA
1 QQQ (12/7)
2 INDA (3/3 & 3/28)
2 EEM (3/13 & 4/3)

2 IWM short hedges

40% net long

As noted in a few daily comments, from here I will include safe havens as positioning options instead of short hedges. GLD and even TLT on buy signal, even VIX, all easier and more profitable than shorts. 

* * *

Positioning limits
15 or 150% long, -50% shorts or hedges, 200% max total exposure. 

Currency & commodity positions are not included in this system. 
Share

Down

File this under "Other technicals."

It has been a while since we have seen risk assets down for the quarter and month. As it happens this is happening across the board, with safe havens positive for the quarter and month thus far. 

Markets can come back evidenced by 2016 Q1 which began January in this condition. It took more than a -10% drop and buyers near YS1s and monthly 50MAs, then a huge recovery in March to turn the quarterly bar positive. 

SPX is -3.28% tick to tick for ~18 trading days, and -2.75% close to close for ~32 days. Where and when will buyers step in this time? 5% from highs would be about 2280. This is also near Q2S1. This is not a forecast, just a possibility. 

15 52 SPX Q.png

Safe havens

Sum
Safe haven message has been loud and clear from the start of Q2P. GLD already above all pivots, and both TLT and most importantly VIX were above Q2Ps as well. XIV has been phenomenal for months but had clear trouble at YR2 and then broke its monthly pivot. 

All this happened before much of the damage in stocks, just as suspected. 

March 19: "I think we will see signs of strength in the safe havens and then possibly VIX/XIV turn before or in early stages of a stock drop. Stage is set for this move, but it hasn't happened yet." 

What next? Levels to watch are VIX 1HP at 15.99. GLD Q2R1, TLT Q2R1 and AGG YP/1HP. 

VIX
VIX jump above Q2P sounded alarm. Terrific job - seriously, i mean it! Also note VIX stopped confirming stock highs with the lowest daily close at the end of January. 
Already at 1HP but not above. This sets stage for stock bounce next week. 

15 32 VIX D.png
15 33 VIX D.png

VVIX
Is this overkill to add the VIX of VIX? Long term chart working pretty well I'd say. 

XIV
YR2 rejection! Also breaking 1HR2. YR1 may test as support. 
One reason I sounded semi-alarm so early was configuration of XIV on 4/5-7. YR2 rejection, small up bar, then pivot break. 
Another thing to watch on a the low is XIV lows within the daily BB - not yet. YR1 would make a nice low. 

TLT
TLT weekly chart far from long term levels.
Daily chart above Q2P was part of the tell. 
Already testing Q2R1, a level to watch for next week. 

15 39 TLT D.png
15 40 TLT D.png

AGG
Testing YP & 1HP! 

15 41 AGG D.png

GLD
Clear hold of YP and 2nd move above 1HP on same week with weekly MACD already on buy was interesting tell. 
Like TLT, GLD already near Q2R1.
GLD gave nearly 3 weeks to buy above all pivots before breaking out up. 

15 44 GLD D.png

GDX
Has been weaker structurally than GLD this year, just climbing above all pivots the last 3 days. 

15 45 GDX D.png

USA main indexes

Sum
Clear bearish action last week, with SPY, DIA and NYA/VTI all breaking Q2Ps with several variations having the "look of rejection." IWM had the 2nd rejection of Q2P, and already not far from Q2S1. USA leader QQQ dropped under its AprP but well above Q2P. 

ES futures and DIA are close enough to levels for recovery, so we'll see what happens. If lower then levels to watch are AprS1s and IWM Q2S1. 

Charts
Cash index weekly charts with long term levels only
Daily ETF chart with long term & medium term pivots
Futures current contract pivots only (no S/R) and MAs for clarity of entries (now June 17 M)
Futures "1" continuous contract with the works

SPX / SPY / ESM / ES1
SPX has held 1HR1 as support once, but the main move here is rejection from YR1 / 1HR2 area.
SPY broke Q2P, the first time below a quarterly pivot since last November. Potential support at AprS1 not far.
ESM level is structurally lower and looks more like fractional break; this could recover.
ES1 similar. 
SPX set sum - rejection from SPX YR1 continues. All 4 variants broke Q2P last week, with the futures only by a few points. 
 

15 1 SPX W.png
15 3 ESM D.png

NDX / QQQ / NQM / NQ1
NDX weekly dropping back under 1HR2; YR1 can now act as support. 
QQQ just a few days under AprP and already near AprS1. Q2P would be a nice buy setup.
NQM still above rising D50MA which could help a bounce.
NQ1 is only sideways since March, healthy digestion of overbought conditions. 
NDX set sum - USA leader well above Q2P, which would be great buy setup should we see that level. Also above rising D50MA. 
 

15 5 NDX W.png
15 6 QQQ D.png
15 7 NQM D.png
15 8 NQ1 D.png

INDU / DIA / YMM / YM1
INDU failed to reach YR1 area, and now has broken 1HR1.
DIA slight break of Q2P but maybe able to recover.
Both YM charts similar. 

15 9 INDU W.png

RUT / IWM / RJM / RJ1
Weekly chart far away from any long term level.
Daily chart 2nd rejection of Q2P, but already near Q2S1.
Daily chart 50MA leveled off for a while before the Q2P break. 
Futures charts similar to IWM.

15 14 IWM D.png

NYA / VTI
NYA break of 1HR1, and daily chart rejection of Q2P.
VTI similar.

15 20 VTI D.png

Valuation and fundamentals

Thomson Reuters reported forward P/E at 17.54, making the 10 MA of the implied earnings estimate at 132.78, about even from last week, and 10 MA of 18x earnings at 2398. Here are the charts. 

And what we are especially interested in, how SPX price has reacted to this valuation level. Keep in mind that I pointed to 18x forward earnings for months and once we got there expected "professional selling" and this is exactly what has happened. 

The 10MA of 17x is now about 2265 so if lower that might be an additional reason for support there. 

Market is reacting from being fully valued. Estimates are leveling off. It hasn't dropped enough to attract value buyers. My interpretation of this is 0.

*

Citigroup Economic Surprise Index dropped from higher levels. Still I give this a 3.

Combined average 1.5. As heavy as market feels it is only normal after a 15% SPX rally off November lows. 

Important stock market tops - summary

I've made a series of posts on tops in the Dow to investigate whether there are consistent technical signatures. Also it is so easy to pull up charts that I figure that almost everyone is very familiar with 2000 and 2007 due to recency bias. Expectations of a similar set up may not happen.

Let's try to think about some core principles.

1. Is market is blow-off phase? 1929 Dow, 1955-56 Dow, 1989 NKY, 2000 NDX, 2007 SHComp, 2015 XBI? 
Blow-off is most easily defined by quarterly RSI 2 quarters 85+. If so, then typically the drop that follows is dramatic. 1955-56 is the outlier here. 

This isn't the case now in 2017. 

2. Is market in a range? This is a weaker top by definition - at previous highs or lower. 1946 Dow, 2007 SPX. 
Also not the case. Most USA main indexes took out the previous range highs in 2013. NDX more recently, and NYA also different structure. NYA also had a much bigger pop higher in 2007 due to global stock inclusion. NDX above its 2000 top is really helping the bull case. There has been a powerful rally above that level and return to 4816 does not look likely anytime soon.

3. Quarterly chart BB & RSI divergence? Monthly chart BB & RSI divergence? Pivot long term level rejection and/or level fail, then break of YP? 

To my eyes, no Q or M chart RSI or BB divergence. This means we are typically more likely to see higher highs ahead to set up those divergence highs. Sometimes there are tops that don't give good indications. More of those are in ranges. Some really do come out of the blue (technically speaking) like 1987.

The more pesky thing is that there are several incidences of seeming BB and RSI divergence setups that don't produce a high. That said, the signature is more likely to produce a meaningful top when it occurs on both quarterly and monthly charts together. 

The real question here - impossible to answer - is whether stocks prematurely broke out of ranges due to global QE, and may lack the technical signatures of true breakouts on the next major top. Perhaps! 

The other thing is that I'd like to chart valuations of pre-IPO companies like Uber and AirB&B, and let's throw Snapchat in this category too. I suspect the parabolic curve is there - yet some not in existence long enough to even have quarterly chart RSI! The beneficiaries of these trends are founders, early stage investors, a circle of well placed employees, and board members - generally not the retail investing public. Sure, FB buyers have done well - after several months and -40% drawdown. Also, for every FB, think TWTR, GPRO, etc. 

But let's keep it simple - long term pivot level rejections merit caution, but usually the real damage happens when multiple indexes are below yearly pivots. Markets made that move in 2016, went down to YS1s (mostly, RUT on YS2) and recovered. There is no telling when it will happen again, but bulls have earned benefit of the doubt with virtually all risk asset indexes above YPs.

Once in a while there is an outlier like 1987 - a dramatic move, not many clues, all above yearly pivot. It is quite rare but if you are following my comments on pivot rejections and VIX at least you would likely be decently hedged. 

Important stock market tops - part 5

Of course, 1987. This was a real scar for people due to sheer velocity, even though hindsight makes it so much easier with full recovery 2-3 years later.

Again this is important for what is not on this top. 

12 8 INDU M.png

Quarterly chart RSI blowoff levels near 90? No, only 1 bar at 86 and others under 85. This is not so high compared to the other historical blowoffs like 1929, 1989 Nikkei, 1999 NDX, etc.

Q chart BB or RSI divergence? Nope.
M chart BB or RSI divergence? Nope. 

Pivots? A bit helpful, with YR2 rejection. 2 weeks later down to YP that held. The next year back above YP and rally resumed!

Important stock market tops - part 4

Here we look at 3 tops from 1961-72, with the quarterly and monthly charts below.  


12 1 INDU Q.png
12 3 INDU M.png

Starting with 1961 Q4 top - which was the third big top in the massive run from 1949 lows to 1966 highs. This top probably doesn't get much attention because the market was down for only 2 quarters and came right back to higher highs in 2 years. But at the time it was -25% and for a little while anyone who had bought 1959+ was under water.

Quarterly chart BB & RSI divergence? Check on both, classic.
Monthly chart same? Definitely, though several of the bars look like decent tops before the damage occurred. 

The next high in 1966 was a more significant top even though price did go higher in 1972. This was because markets were essentially sideways until the 1982-83 breakout. 

Quarterly chart BB & RSI divergence? Bollinger bands yes, RSI somewhat, though the market also "looks like" a top in 1964 Q4 and 1965 Q1.
Monthly chart showed the strength in 1964-65 though, and looks like divergence high only in 12/1965 and 1/1966.

Lastly, passing over the 1968 top because that is pretty obvious, the 1972 was really a fake-out / failed high. quarterly chart RSI hadn't even reached overbought and monthly chart hadn't either. The line was the previous high and anything below that was vulnerable.

Turning to pivots, the 1961 top was a near YR2 tag, and the real damage didn't happen until the YP break in 1962. Another low near YS2 FWIW. 

Pivots on the 1966 top, 1965 had clear YR1 rejection, straight down to YP that held, then back up. 1966 YR1 / 1HR1 fail, and again break of YP before real trouble. 

Pivots on 1973 top were also 1HR1 / YR1 fail and fast trip down to YP that failed. The backtest in later 1973 also failed and then the real trouble began. 


Important stock market tops - part 3

This post is important for the indicators that were present on a stock top that lasted about 2 years, the Dow top in 1956. Unlike others, this was not a huge top in the scheme of things, but this is exactly what it catches my interest. 

This somewhat stymies my theory of quarterly chart RSI extreme - 1955 Q3 88.7, Q4 89.8, 1956 Q1 90.8. This is pretty close to 1929 levels, but instead of -89% all that happened was a -20% over 2 years and again off to races. 

At least the monthly chart was nice enough to put in small doji-like top bar inside the Bollinger band, and then glaring RSI divergence on the high test before the pullback. But looking ahead, monthly chart handed investors the ideal buy at the multi-month hold of the rising 50MA. 

The weekly long term pivots chart has a double top on YR1 in 1956 and the low on YS2 in 1957. 

Sum - Sometimes everything is set up for a massive top, but all that happens is -20% over 2 years and frantic bull rally resumes. 

Important stock market tops - part 2

Continuing a series.

The 1946 top doesn't get the attention of 1929, and admittedly was taken out about 4 years later. But at the time was nothing to sneeze at with -25% and 4 years before coming back to even. I find the historical context also interesting - global war over, Depression over, USA on top, and yet market rallies less than a year after the end of WWII and then stops cold? 

Quarterly chart gives Bollinger band divergence high with RSI overbought, OK - let's keep in mind this occurred many times after 1946. 

11 1 INDU Q 1946.png

Failing to sustain above the previous 1936 high seems to have been a factor in the drop.

Monthly chart shows the Bollinger band and RSI divergence more clearly. 

11 3 INDU M 1946.png

Weekly long term pivots chart shows rejection of YR1 and subsequent break of 2HP. The lows that mattered in 1948 and 1949 were on YS1s FWIW. 

Sum - totally different top than the blowoff 1929. This was really a test of a high in a range which failed. It is easy in hindsight to say Bollinger band and RSI divergence, but that happens many times without a subsequent drop. It is a combination of factors on quarterly, monthly and pivots that can help identify this as a major top. 

Important stock market tops - part 1

Everyone who looks at charts knows how the 2000 and 2007 tops unfolded. Most people conclude from these tops that a period of distribution, waning momentum and RSI divergence will occur before any top of significance.

I thought it would be interesting to look at other tops to see if the conclusions most people typically reach by emphasizing the technical structure of the 2000 and 2007 tops is correct. I will approach each through standard charts (typical moving averages, RSI and Bollinger bands) and pivots. 

1929 Dow Industrials monthly chart
Please look at the chart below. I don't think there are too many clues here. There is a huge reversal bar in Sept 1929 after a Bollinger band divergence top, but this was also exactly the case in May of 1929 as well. There were several Bollinger band and RSI divergence highs on the way up - 12/1925, 8/1926 12/1927, 4/1928, 4/1929 - so why would you think that 8/1929 would be it?

Moving averages may have been some help. The monthly 20MA held several times in 1926 and 1927, and then the 10MA took over as support. If you bailed with stocks below the 10MA, you didn't nail the high, but at least you avoided massive damage after Oct 1929 to June 1932. 

10 3 INDU M 1929.png

The quarterly chart is more clear. Why? RSI 90 on two consecutive quarters means the market has gone berserk. Even if the first candle with wick didn't concern you in 1929 Q1, the second sure should have in 1929 Q3. This is more an example of a blow-off top and crash than orderly slowdown, distribution & divergence top like 2000 and 2007. 

The long term pivots chart shows rejection from YR2, then a break of 2HP. While rejections from levels did occur on the way up in 1927 and 1928, the simple criteria of closing below a long term pivot avoided massive damage in both 1929 and 1930.

Total market view

REVIEW
4/2 Total market view: "As usual I will let pivots be my guide - if the majority of stock indexes are above Q2 pivots, or test and hold, then it is correct to stay bullish on risk assets. But if stock indexes open below Q2 pivots or break, as safe havens are above Q2 pivots, then it is correct to be defensive. We'll see what happens."

Result: Most USA stock indexes are above Q2Ps, but not XLF & IWM. Safe havens strengthened last week, leading to portfolio's more defensive positioning. 

SUM
SPX ralled 15% from 11/4 low to 3/1 high over 84 trading days, an impressive rally in both gains and duration. Since 3/1 there was a -2.75% drop (measured from high tick to low tick; measuring on daily close levels would be less of a decline), thus far over 18 trading days. This is a very mild pullback and thus far a healthy slowdown of a great rally. But I suspect the digestion period is not over yet; either stocks will go lower than the -2.75% drop, or the market will have more sideways than just 3.5 weeks. 

Stock indexes continue above most pivots. USA main index leader QQQ remains above all pivots and from this measure it is valid to stay mostly bullish on the market. 3 others, SPY DIA and VTI, are above Q2Ps. Of the USA mains, only IWM is below the Q2P. Global indexes, while not quite as strong as the start of last week due to EWZ & RSX drop, are still looking good too. 

However, at the end of last week safe havens perked up in a way that we haven't seen since before the election: VIX closed above a quarterly pivot, XIV closed under a monthly pivot, and TLT also closed above a quarterly pivot. If we ignore 1 day fractional break on XIV, then none of these have happened since before the election. In mid-March GLD tested and held its YP and since then rallied to be above all pivots as well. I think the combined effect of strength in safe havens increases the chances for further declines for stocks, or at least will limit upside.

Though at this point expect further declines or limited upside for stocks, sentiment is already quite bearish with 2 of 4 meters reaching fairly low levels. This may limit declines to one day bear wonders that quickly reverse. 

BOTTOM LINE
Portfolio switched defensive last week with VIX jump above Q2P and further XIV confirming trouble on 4/7. If safe havens back off and SPY jumps above AprP, then green light to lift hedges and return more long. If safe havens stay strong and stocks decline further, portfolio is nicely positioned as long as IWM participates in the drop. I'm a bit concerned about the IWM short hedges given bearish sentiment.

POSITIONING
Staying long risk with hedges that can quickly be covered, should the warning signals given by safe havens diminish.

PIVOTS
USA main indexes - leader QQQ above all pivots so one cannot be too bearish. 

Safe havens - yet some strength in all safe havens that hasn't happened since before the election.

Other sectors of note - XLF below Q2P means most popular Trump trades, XLF and IWM, below Q2Ps.

Global stocks - Week started out with all 7 global indexes above all pivots. That has weakened a bit with RSX and EWZ below Q2Ps.

Currencies and commodities - DXY just had massive hold of YP and near tag of D200MA, and since has rallied back above 1HP, AprP and currently testing Q2P, even fractionally above. This likely puts lid on global stock strength.

OTHER TECHNICALS
RSX quickly turning into the weakest index I track, below Q2P and below weekly 200MA. Possible short.

VALUATION AND FUNDAMENTALS
SPX fully valued near 18x forward earnings at the highs. Fundamentals positive but losing momentum. 

SENTIMENT
On 2 of 4 measures, crowd already quite bearish. This tends to limit damage and duration of stock declines and adds possibility to short squeezes. 

TIMING
(Proprietary experimental work in progress model)

April dates
4/6-7 - possible stock low & safe haven high of stocks up week of 4/10
4/10 - TBD
4/19-20 - looks bearish for stocks, positive for safe havens
4/26


Positioning

Came into week with:

2 DIA (first positions near election with shuffle week of 1/30)
1 XLF (pre and post election)
1 QQQ (12/7)
3 SPY (2 on 1/3, added 1 3/28)
1 SMH (1/18)
2 INDA (3/3 + 3/28)
1 EEM (3/13)

-1 QQQ (3/31)

11 longs, -1 short hedge, 100% net. 

Adjustments
4/3: -1 XLF, +1 EEM; -1 SPY, +1 EWZ
4/4: None
4/5: -1 EWZ, 2 EEM short hedges, 2 IWM short hedges
4/6: QQQ short hedge cover
4/7 None

Currently

2 DIA (first positions near election with shuffle week of 1/30)
1 QQQ (12/7)
2 SPY (2 on 1/3)
1 SMH (1/18)
2 INDA (3/3 + 3/28)
2 EEM (3/13 + 4/3)

2 EEM short hedges 4/5
2 IWM short hedges 4/5

10 longs, 4 short hedges, 60% net


Positioning limits
15 or 150% long, -50% shorts or hedges, 200% max total exposure. 

Currency & commodity positions are not included in this system. 
Share
 

Sentiment

While I used to do a full sentiment analysis weekly while working a fund, these days I glance at it and bring it up when more important.

Sentiment extremes in August and December 2016 were part of accurate top calls. In late February readings were not quite as toppy as December, but put-call at low areas and NAAIM also at extremes. So 2 of 4 seemed to do the trick.

But now after a relatively mild decline we are seeing some readings that are decently bearish. If crowd is already bearish after 3 weeks and ~2% drop, then further declines just might not get very far. 

Consider the only handful of days since 2016 where daily put-call 10MA has been higher than its recent level reached on 4/4. 

8 50 put-call D.png

But when I saw ISEE my jaw dropped - 28% bulls! Of all readings since 2010, that is 84% percentile LOW end. 39% bears are 13th percentile, and bull-bear spread is about the same. 

So we have 2 of 4 readings showing decently low readings. NAAIM has gone from wildly bullish to middling, and just to confuse things a bit ISE (non pro options) gave a high spike reading on 3/31. 

Safe havens

Sum
Main point for stock exposure is that VIX is above Q2P and XIV has both YR2 rejection and AprP break on same day. So to my view, these are looking more threatening for risk assets since before the election. 

TLT & AGG both above Q2Ps for the first time since September 2016. While not getting far, this is a change in status that adds to stock concern. 

GLD above all pivots. 

Simply stated environment is very different from last fall where all safe havens were confirming risk on in stocks, and also different from 2017 where only GLD showed any concern. 

VIX
Weekly chart does not look threatening.
Daily chart has had a few fake-out bars since March. 2 of last 3 days above Q2P, and clear support on the Q2P on Friday.
D200 still acting as resistance, and VIX highs after 3/27 all inside BB.
VIX sum - VIX sending some warning with support at Q2P. 

8 30 VIX W.png
8 31 VIX D.png
8 32 VIX D.png
8 33 VIX D.png

XIV
Weekly chart clear resistance at YR2!
Daily chart AprP break and MACD about to go negative first time since November. 
XIV also sending warning sign, but if lower then Q2P and rising D50 also there as support. 

8 34 XIV W.png
8 35 XIV D.png

TLT
Weekly chart sideways all year thus far.
Daily chart first time above Q2P since September 2016, but cannot get going. Remember - still below YP and 1HP not best choice for longs. 

8 37 TLT D.png
8 38 TLT D.png

AGG
Above Q2P and AprP, also above D20 and D50; but no follow through to Q2 rally attempt. 

8 39 AGG D.png

GLD
Nice clear hold of YP on March lows. 
So far trouble at 2017 closing high.
D200 also so far trouble again.
GLD sum - After holding YP Q1P area 3/9-15, GLD resumed above 1HP also 3/15, then above all pivots on 3/21. D200 still acting as resistance. 

8 41 GLD D.png
8 42 GLD D.png

GDX
I don't know what is wrong with GDX this year to be structurally weaker than GLD. Still under 1HP, but holding Q2P.

USA main indexes

Sum
2017 USA main index leader QQQ remains above all pivots and holding rising D20MA. Next 3 in line, SPY DIA and NYA/VTI are configured similarly - below AprPs but so far above Q2Ps. Lastly 2017 laggard IWM Q2P rejection. 

So, if leader continues to hold above all pivots that is bullish. If the other 3 join QQQ back above all pivots that is also clearly bullish and likely a scenario to take off hedges and go more long. Or the other way, if QQQ breaks AprP, others are probably going lower and testing Q2Ps. 

Charts
Cash index weekly charts with long term levels only
Daily ETF chart with long term & medium term pivots
Futures current contract pivots only (no S/R) and MAs for clarity of entries (now June 17 M)
Futures "1" continuous contract with the works

SPX / SPY / ESM / ES1
SPX weekly chart continues to digest the amazing post election run of about 4 months powerful up. Let's face it folks, often the digestion is longer than the power move itself, so markets could be in for a long stretch of nowhere. 
SPY clear resistance at the AprP. If that keeps a lid on price then support at Q2P, and below that 1HR1 and AprS1 could help, then Q2S1 area. If back above all pivots that is clearly bullish and we can think AprR1 YR1 area, but I think the odds of this are slim. 
ESM holding D50 in purple, and near test of Q2P overnight. 
ES1 chart showing similar, with decent divergence lows entirely inside the daily BB.
SPX sum - High on YR1 / 1HR2 / Q1R2 cluster resulted in a 3ish week drop but not big %. Thus far AprP acting as resistance. If higher then green light for more longs; if down then test of Q2P very likely.

8 3 ESM D.png
8 4 ES1 D.png

NDX / QQQ / NQM / NQ1
Weekly chart above 1HR2, strong.
Daily charts above AprP and above rising 20MA. 
NDX sum - 2017 USA main index leader still looking incredible here above all pivots and rising D20. 

8 7 NQM D.png
8 8 NQ1 D.png

INDU / DIA / YMM / YM1
INDU trying to hold 1HR1 as support. 
Daily charts below AprP but futures holding tests of Q2P and rising D50 helping out. 
INDU sum - similar to SPX here.

8 11 YMM D.png

RUT / IWM / RJM / RJ1
Not a fan of patterns, but i guess that could be head & shoulders on RUT W.
Daily chart clear rejection at the Q2P, but futures show low already on Q2S1. 
RUT sum - 2017 laggard below Q2P and falling D50MA. 

8 15 RJM D.png
8 16 RJ1 D.png

NYA / VTI
NYA weekly trying to hold 1HR1 as support. 
Daily chart below AprP, so far holding Q2P.
VTI similar.
NYA / VTI sum - These also configured like SPX. NYA Q2P part of next market tell.

8 20 VTI D.png
8 21 VTI D.png

Valuation and fundamentals

Earnings estimates according to Thomson Reuters are starting to level out. 

Here is the 10 period moving average of the raw earnings estimate itself.

Multiply this by 18 and you get implied 18x forward earnings for SPX. Same slope.

And here is how SPX has reacted to this valuation level.

The level was tagged on 3/1 highs, but did not exceed on weekly close. 

Basically, 18x forward earnings as stopped the rally; and of more concern, earnings estimates are starting to flatline. This increases the chance of a range or drop going forward. Because the 10MA level of 18x forward earnings was lower than last week, I'm giving valuation score a -1.

*

Citigroup Economic Surprise Index dropping from a high level. Still decent, but not the same as going up. This gets a 3.

Combined total on scale of -5 to 5 = 1. Not impressive but still positive. 

Q2 and April pivots

Quick rundown of the charts frequently mentioned on this site. These are "pivot only" charts meaning no support (green) or resistance (red) lines, to focus on the new Q2 (in crosses) and Apr (dots), as usual in orange.

Including the typical MAs to help with trend analysis. Keeping it simple here with ETFs only, though in reality indexes and futures levels should be factored in for full reliability. 

USA mains - SPY QQQ DIA IWM VTI
In some cases below a monthly pivot after being above for 4+ months would be more a threat, but I'm weighting the successful test or near tag of Q2P and rising D50MAs. 

5 2 QQQ D.png
5 2 QQQ D.png

Safe havens - TLT AGG GLD VIX XIV
TLT & AGG above Q2P first time in months is a factor, and could be a considered as a small longs (not full since still below YP and 1HP).
GLD looking good above all pivots and nice recent hold of YP.
At same time, VIX and XIV could not be clearer, green light for risk.
 

5 7 AGG D.png

Dollar
Huge hold of YP and near D200MA test - what a setup on 3/28. Now above YP & 1HP, below Q2P and AprP. DXY stall has allowed global stocks to rally so the global longs want to see DXY stay under Q2P and better under AprP as well. 

11 DXY D.png

Global stocks - ACWI EEM FXI SHComp FXI RSX EWZ
On a tear, all above all pivots! Hard to remember seeing this when most USA indexes have not met this condition. Really I was late to this move as rotation began in January when already fully long USA stocks but at least in INDA before the big pop and currently global overweight. 

5 13 FXI D.png
5 14 SHComp.png
5 15 INDA D.png
5 16 RSX D.png
5 17 EWZ D.png

USA sectors - XLF SMH XBI XLE
XLF below Q2P
SMH above all but looking a bit tired
XBI below AprP
XLE just held YP potential positive, but under D200, 1HP, Q2P, falling D50, and testing AprP - i'd rather be long EWZ or RSX

5 19 SMH D.png
5 20 XBI D.png