Sum
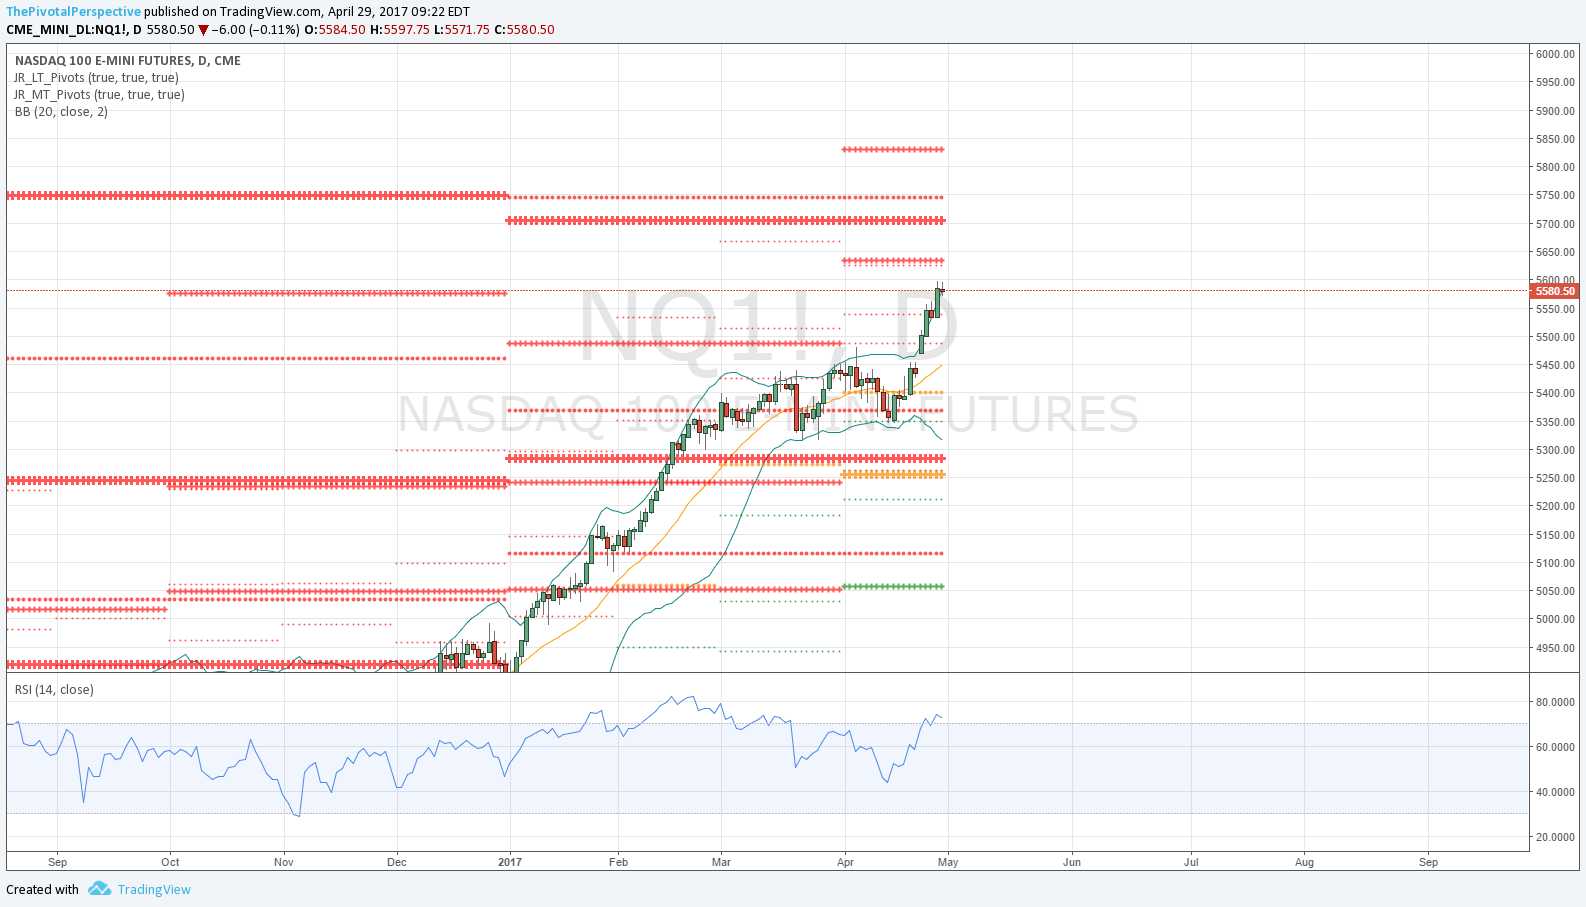
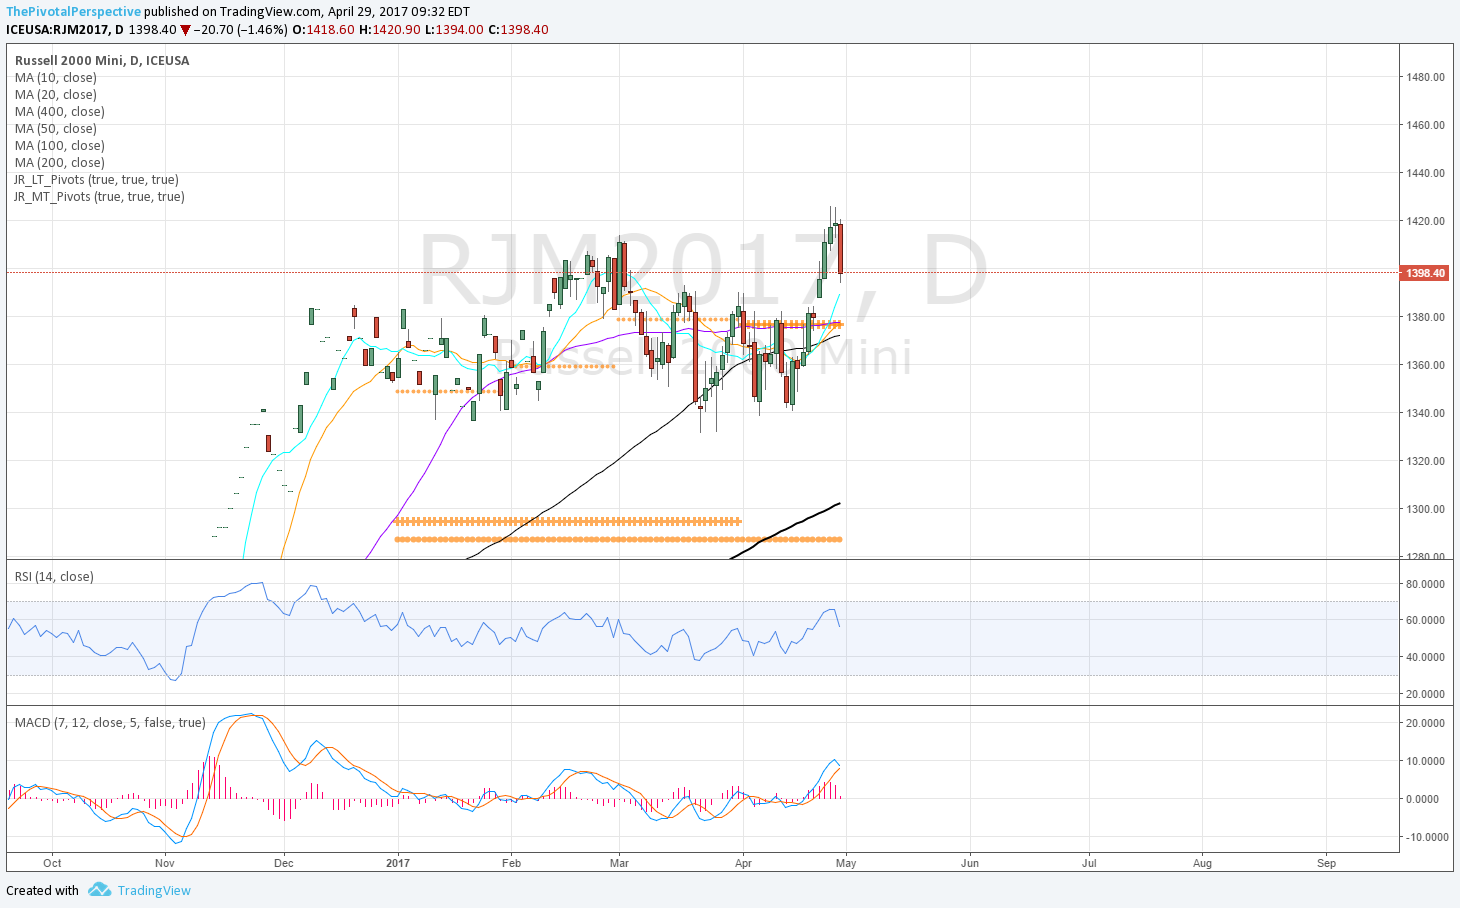
2017 USA main index leader NDX / QQQ looks fantastic, with convincing new highs, not yet at pivot resistance, and no other warning sign such as RSI divergence. Others are not in the same league: SPX and NYA/VTI both stalled at 3/1 close high levels, with SPX near tag of 1HR2 as well. RUT set reached Q2R1 but then major selling from there and back under 3/1 highs, making that look like a failed high. INDU mild drop from AprR1.
So the leader still strong, but the others leave some to be desired. If higher, I think the SPX set YR1 / 1HR2 / Q2R1 combo will cap upside. New MayPs in play on Monday, and bulls will want to see all 5 indexes stay above these levels for better chances of another push to highs.
Charts
Cash index weekly charts with long term levels only
Daily ETF chart with long term & medium term pivots
Futures current contract pivots only (no S/R) and MAs for clarity of entries (now June 17 M)
Futures "1" continuous contract with Bollinger bands
SPX / SPY / ESM / ES1
Weekly chart looks quite toppy here with test of YR1 1HR2 area.
SPY a bit shy of levels.
ES still on buy and MayPs will be telling.
ES1 also has red line drawn at the close highs.
SPX set sum - Trend is up but chances of a top have now increased with SPX 1HR1 near test and down as well as selling at the 3/1 close highs. If higher, then 2400-2407 significant resistance which includes SPX YR1, 1HR2 and Q2R1.
NDX / QQQ / NQM / NQ1
Still superstrong and looks like it should reach YR2.
QQQ includes medium term levels and Q2R1 is the first level to reach, then YR2, then 1HR23 is above that.
NQM huge hold of D50MA.
NQ1 blasted above the prior highs.
NDX set sum - 2017 leader still doing incredibly well.
INDU / DIA / YMM / YM1
Similar pattern as SPX, but not on any long term level.
DIA near tag of AprR1 though (cash index also near tag of AprR1).
YMM will likely open above MayP.
YM1 not quite at previous close highs yet.
INDU sum - Tag of AprR1, but could come back. Major cluster above previous highs at YR1, 1HR2 and Q2R1 all 21325 to 21425, roughly.
RUT / IWM / RJM / RJ1
Weekly chart doesn't look terrible from this view.
But daily chart has serious concerns with rejection of Q2R1 and failure at 2015 highs.
RUT sum - Q2R1 resistance and prior high rejection just does not look good.
NYA & VTI
These didn't reach any pivot resistance levels on the recent highs, but clear selling from the 3/1 close highs shown in red on the daily charts.


