Sum
All USA main indexes are testing medium term resistance.
SPY on Q3R1 and JulR2
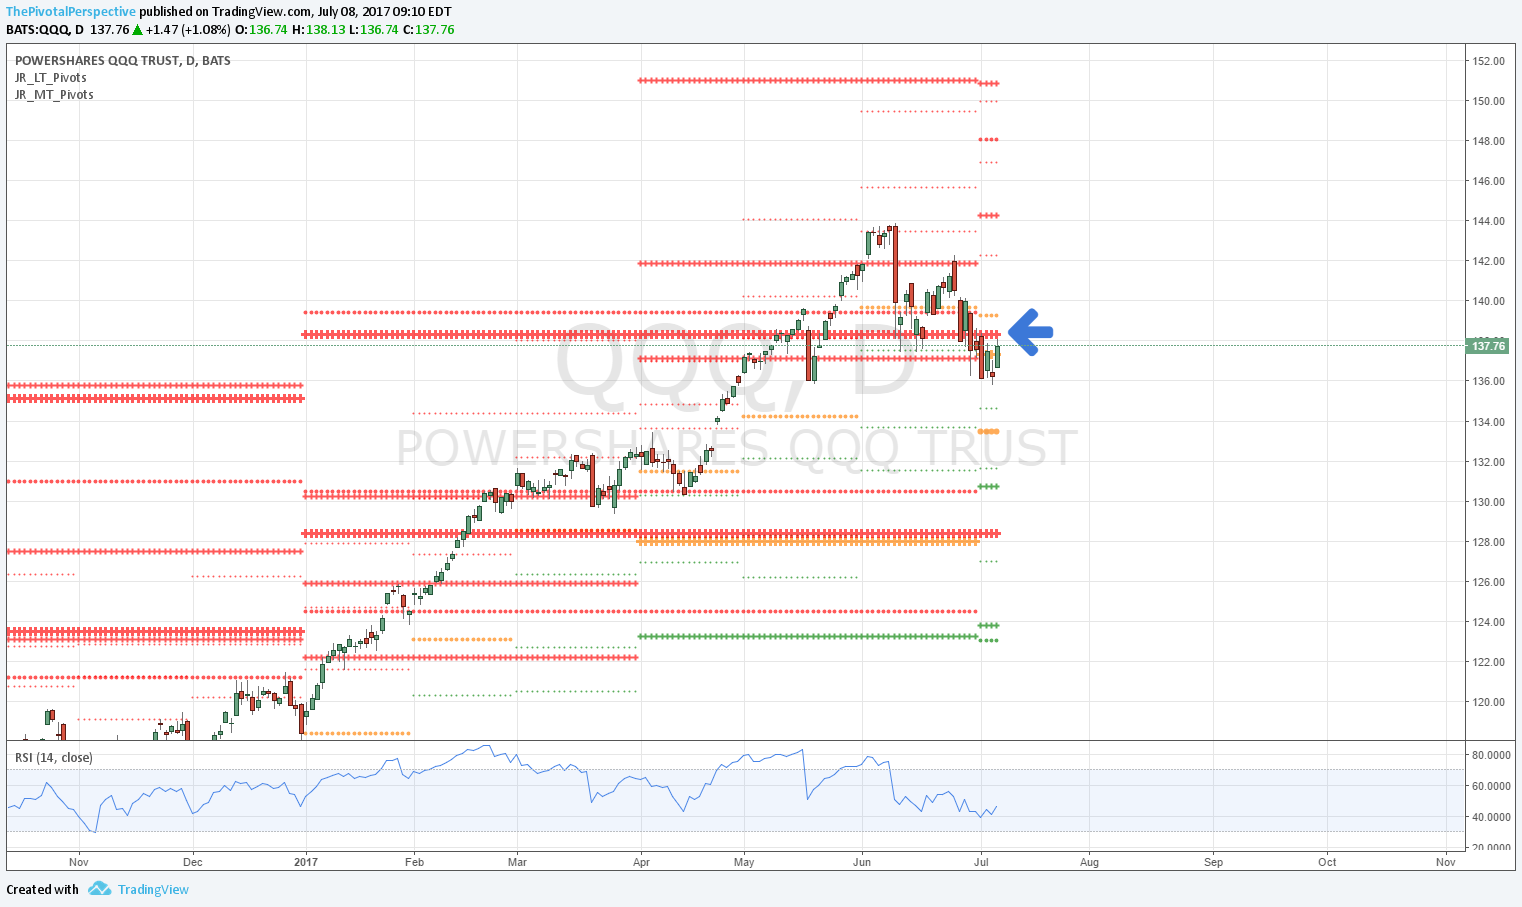
QQQ on Q3R1
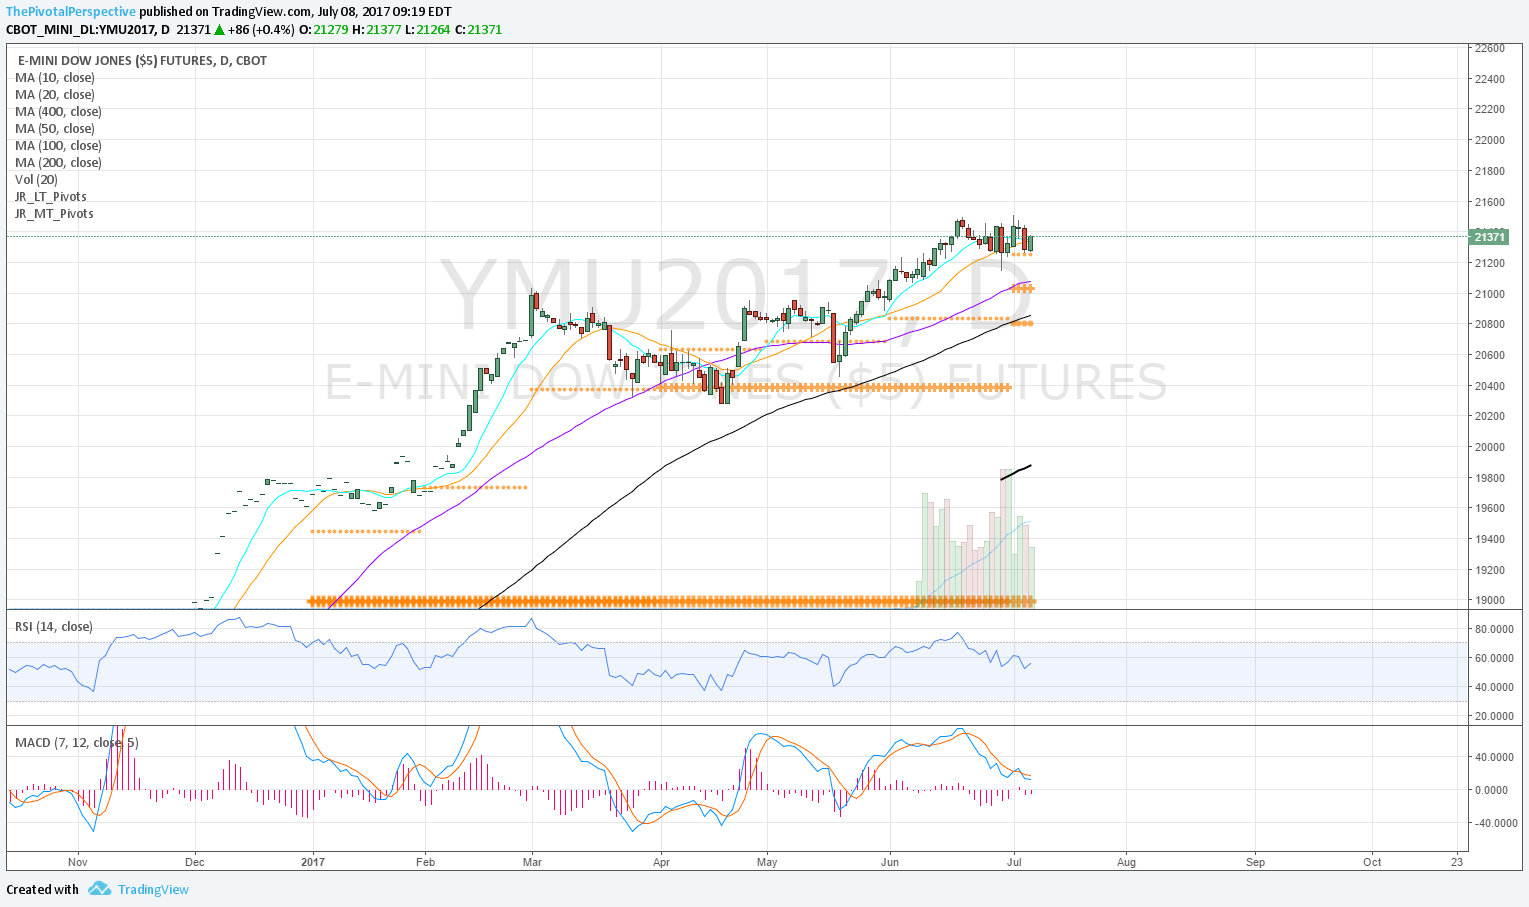
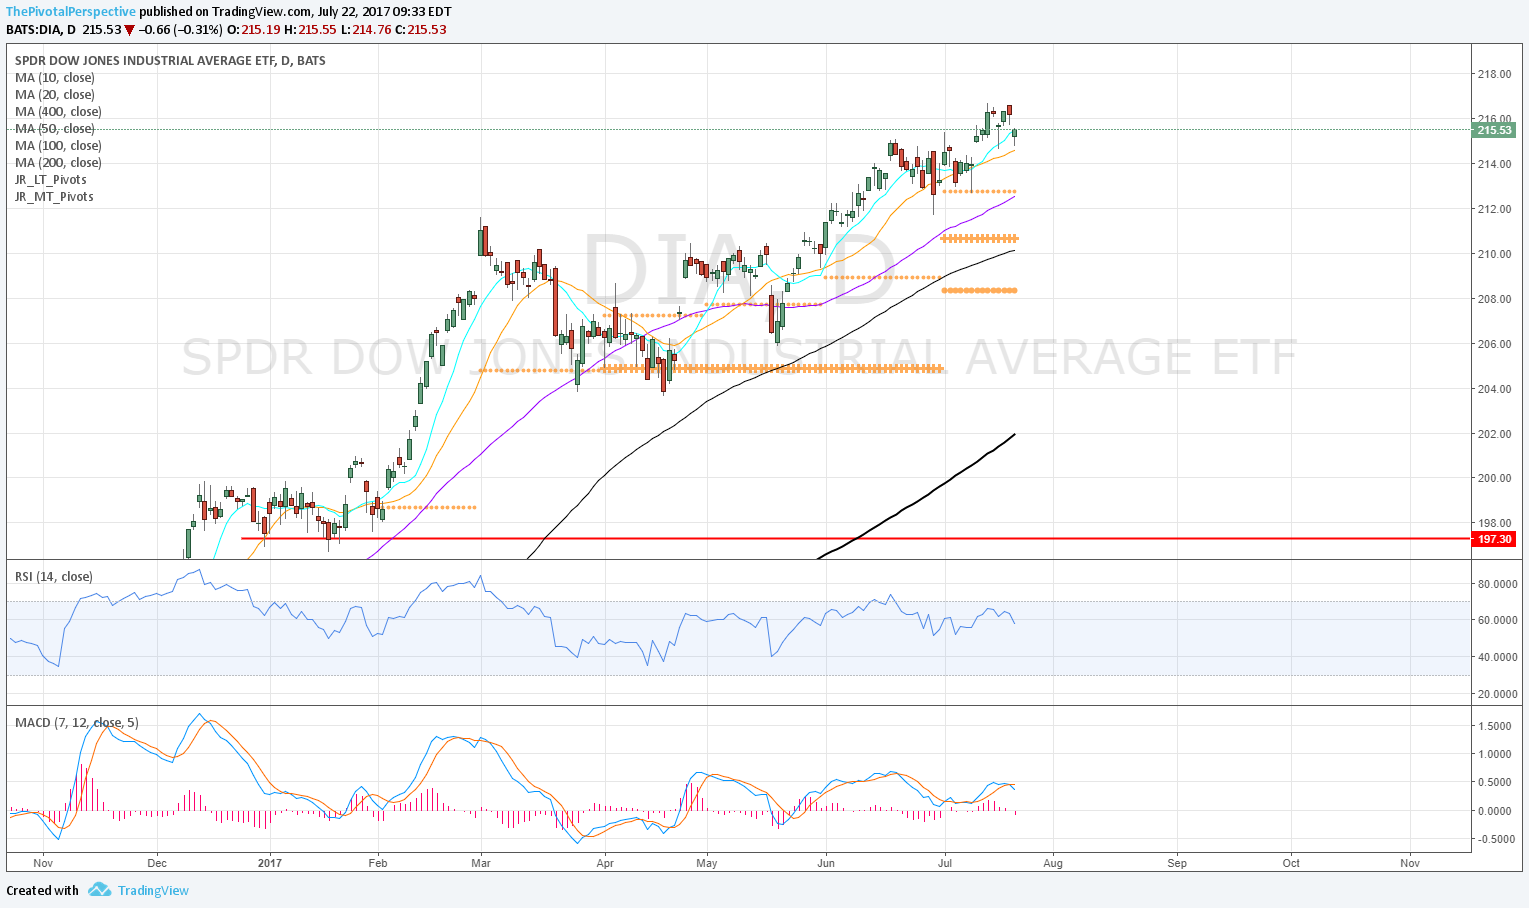
DIA on JulR1
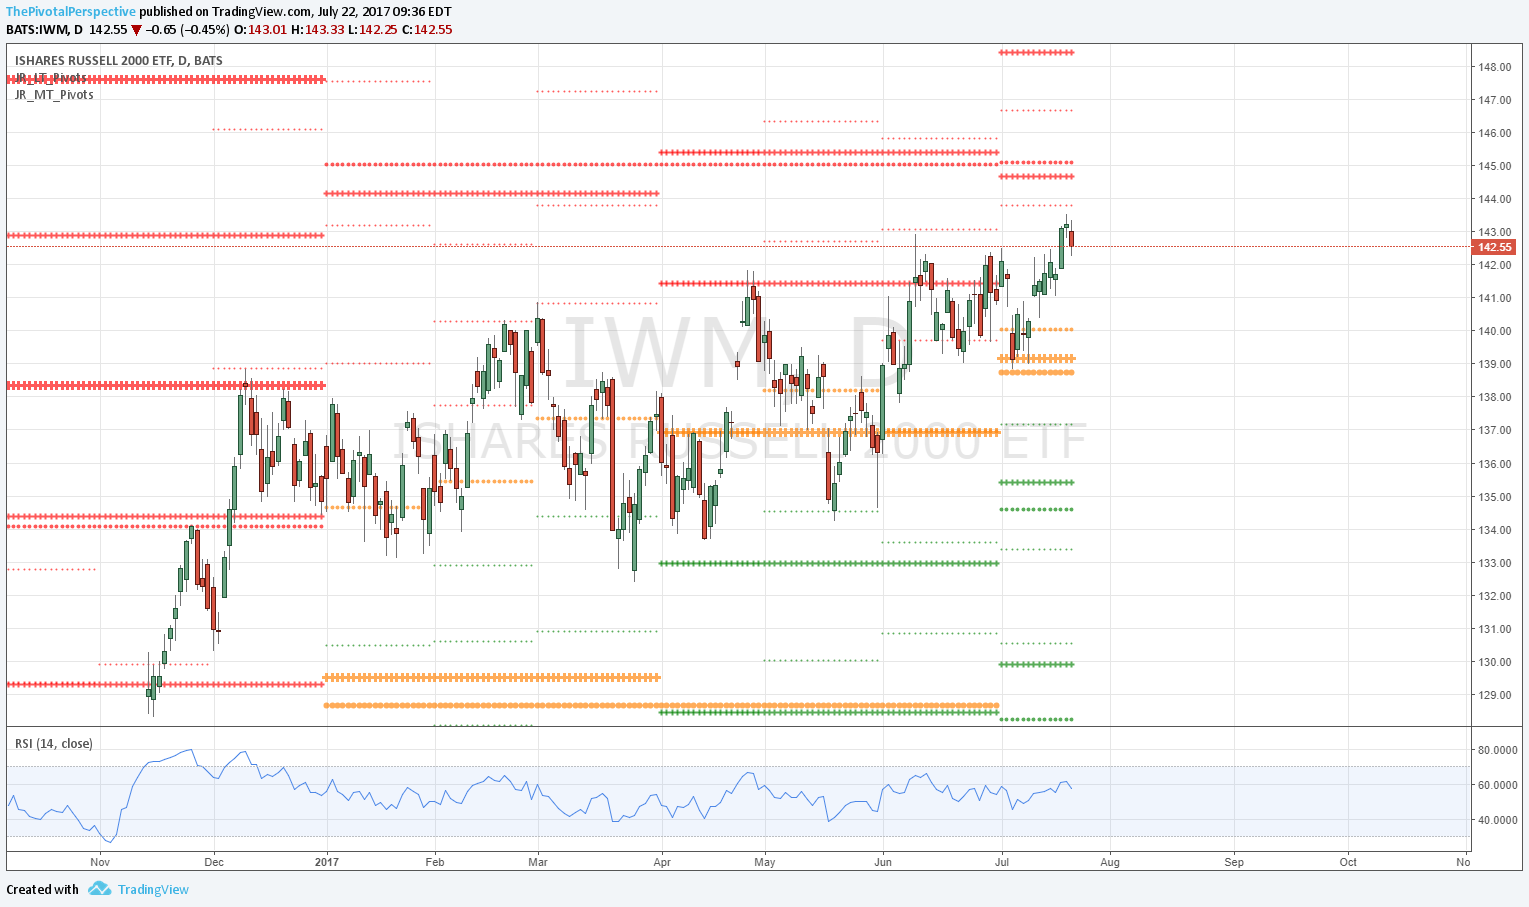
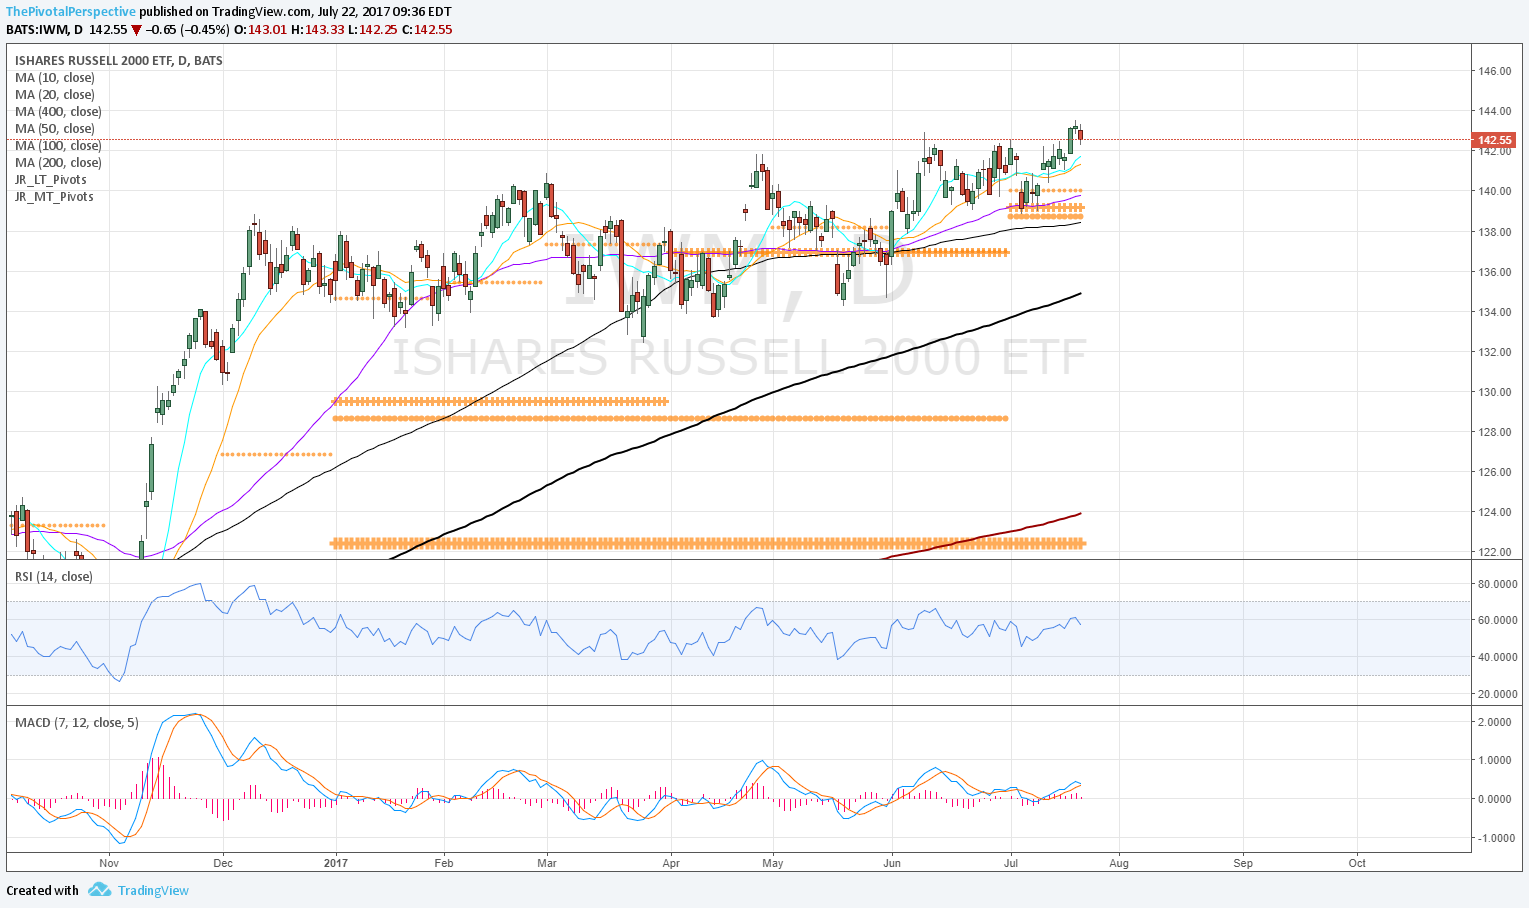
IWM near tag of JulR1, and cash index shows rejection at 2HR1
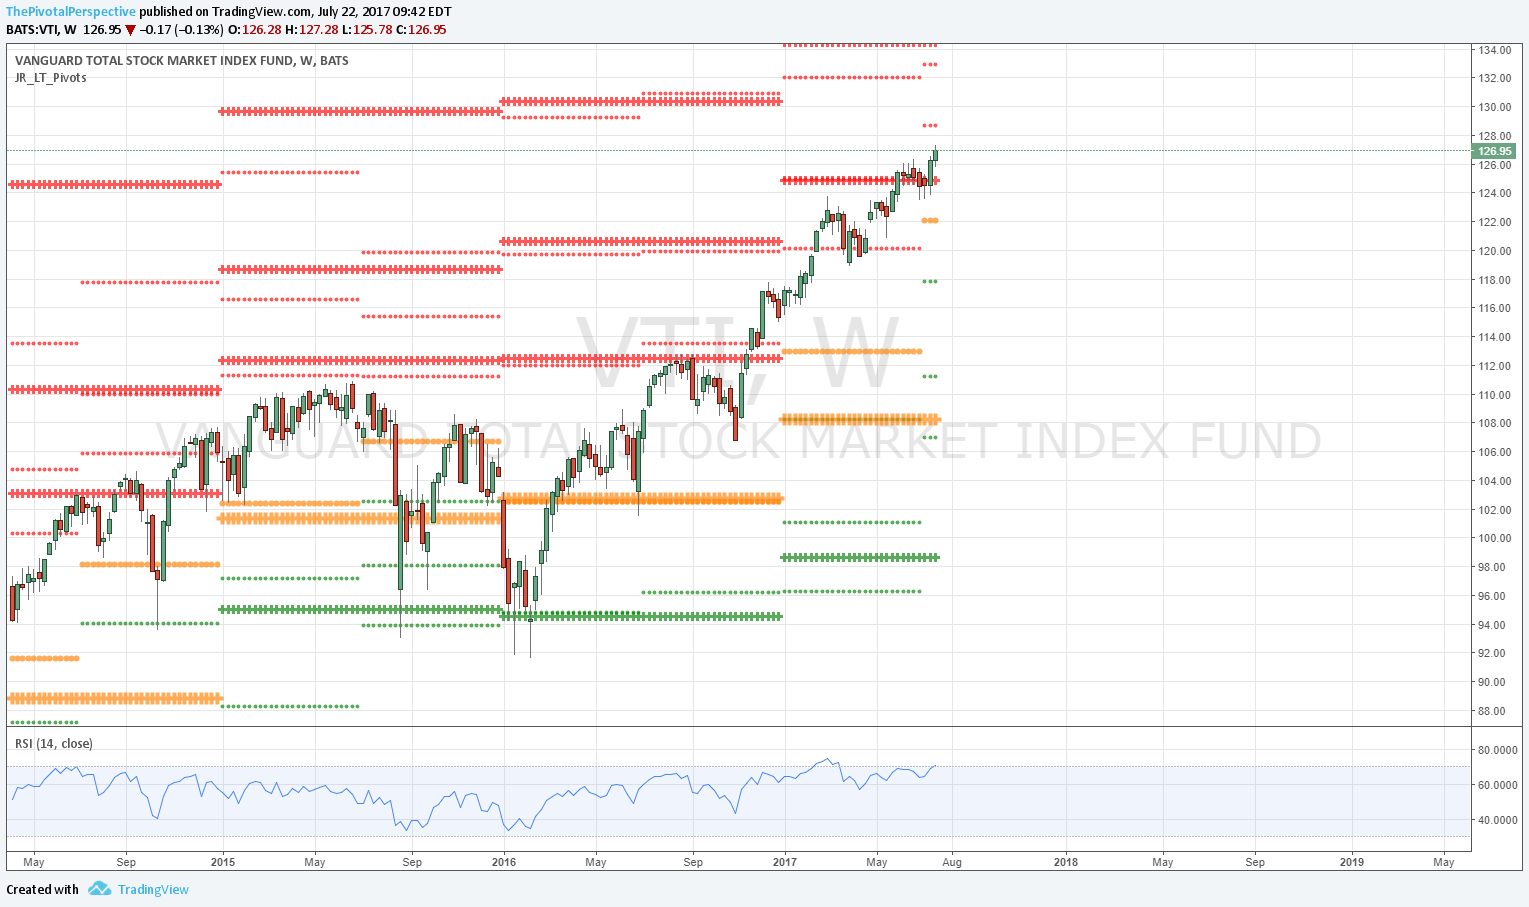
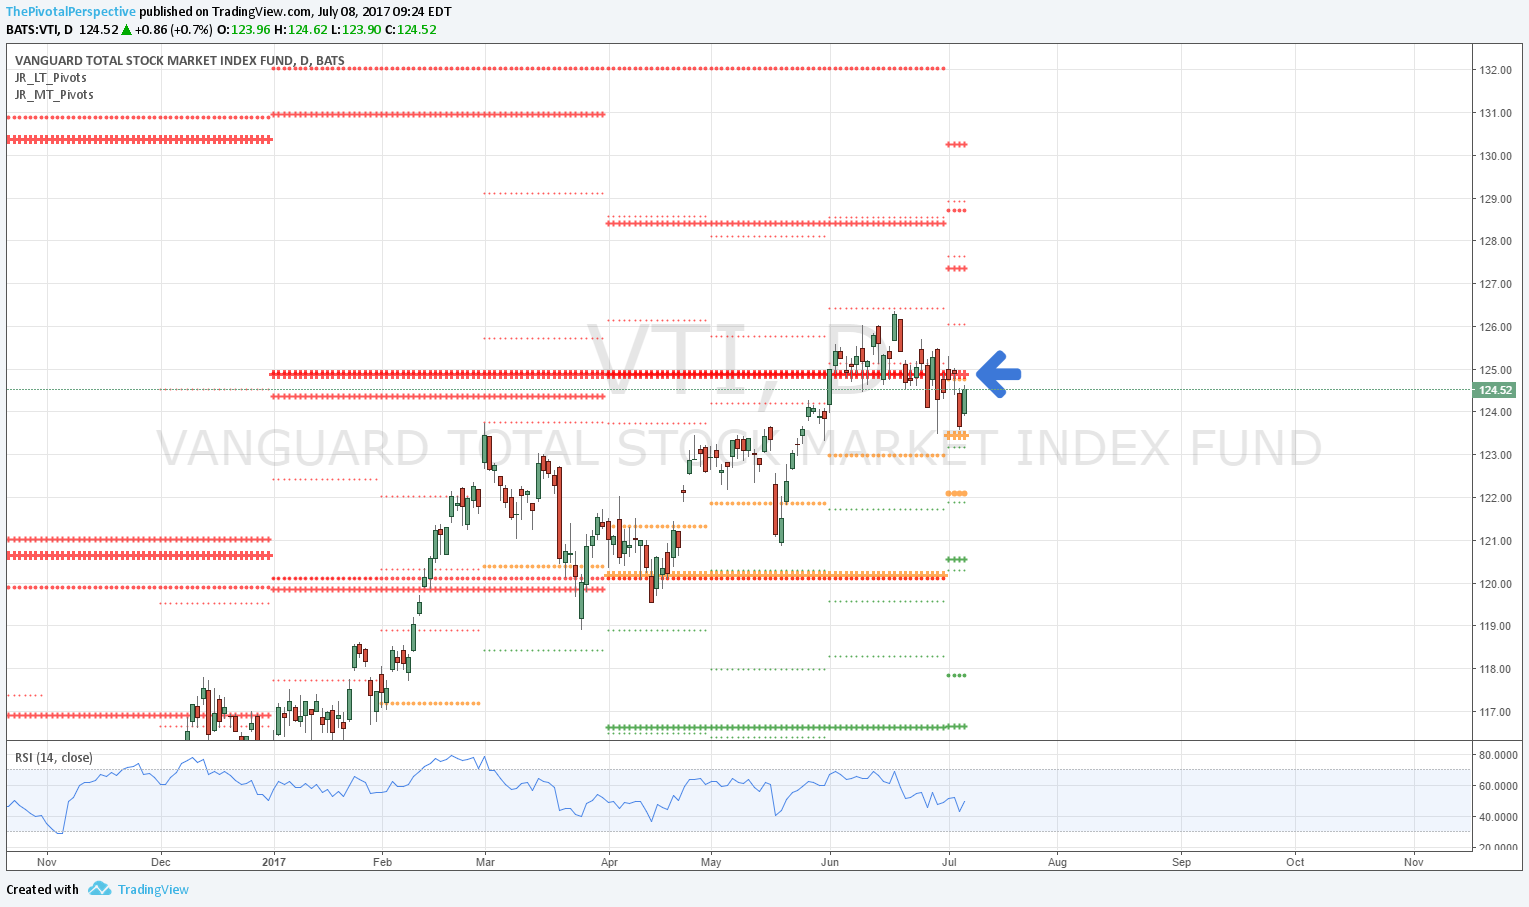
NYA and VTI both on Q3R1
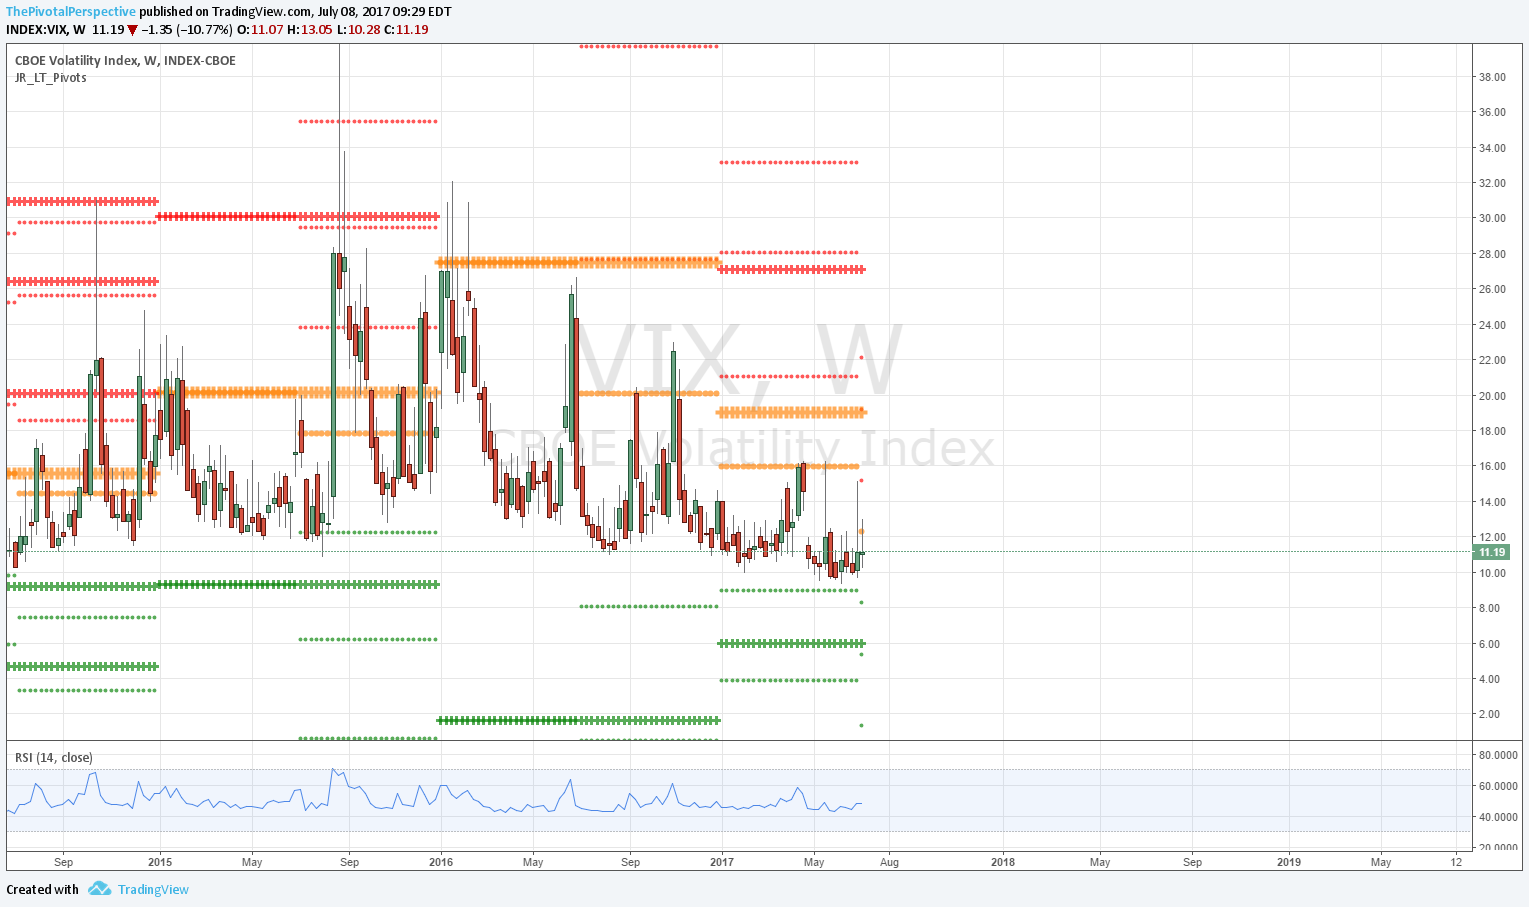
Thus far we are seeing a pause not a rejection, but given weekly chart RSIs on QQQ and VTI especially, along with upper Bollinger bands on weekly SPY, DIA, IWM and VTI, a reversal here has decent odds. Bearish concerns would be alleviated with any clear and close above Q3R1s next week.
Also, with all USA main indexes above all pivots and all MAs all with rising slopes, cannot get carried away with any bearishness.
SPX / SPY / ESU / ES1
SPX W: Looks like it should reach 2HR1 2503.
SPY D: For now, Q3R1 and JulR1 resistance.
ES U: Look at all the nicely rising moving average lines.
ES 1: Possible reversal bang on on Q3R1 and JulR2, with RSI up to 68.2 at the recent peak.
SPX sum - Healthy uptrend but pause or possible reversal on Q3R1 and JulR2.


NDX / QQQ / NQU / NQ1
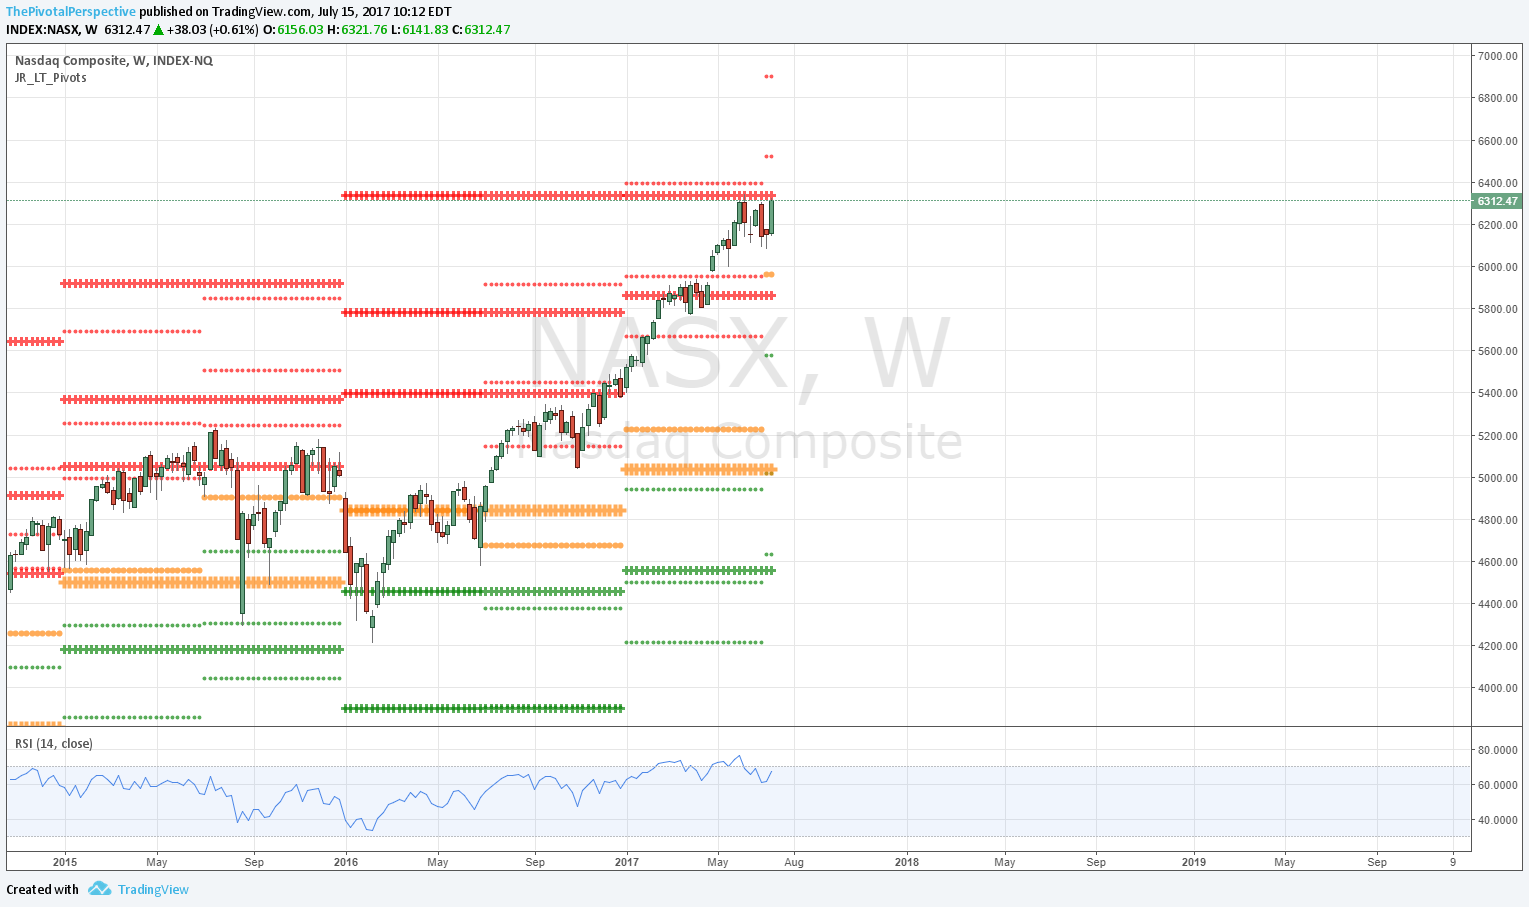
NDX W: Looks like higher levels possible. Watching weekly RSI carefully.
QQQ D: So far no selling at prior high area, but also at Q3R1.
NQU D: In 5% drop, only 10 and 20MA broke and bent; 50MA broke but did not bend; nicely rising D100 near the low, and D200 not seen since early July 2016!
NQ1: So far more like pause not reversal.
NDX sum: Strong uptrend but near prior highs and Q3R1 worth watching for possible reversal. Also watching RSI on weekly chart.


INDU / DIA
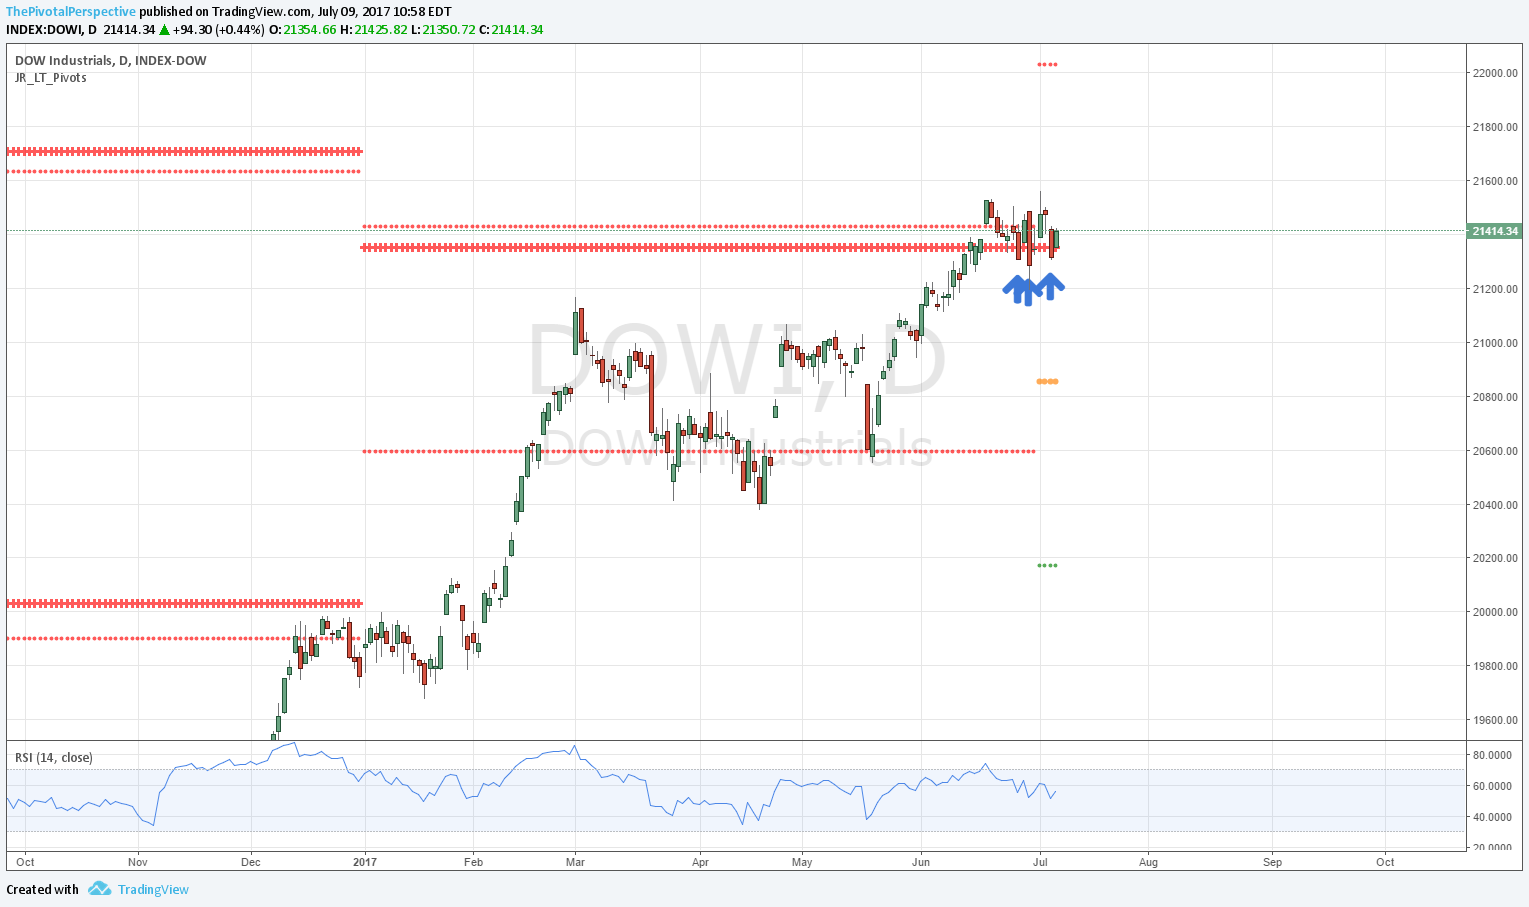
W: Still doing fine above YR1.
D: Did not reach Q3R1, and back under JulR1.
INDU sum: Above all pivots, all MAs rising, above all MAs; JulR1 watching as possible resistance.


RUT / IWM
RUT W: Looks about to get whacked. Not sure how the cash index shows higher high and reversal on Friday but maybe option expiration related.
IWM D: JulR1 near tag and down. Still a more threatening reversal here than the others, below the low of the high bar.
IWM D: Above all MAs, with all MAs having rising slopes.
RUT sum: More threatening reversal here, especially the look of the cash index. However, still decent uptrend above all pivots and rising slope MAs so cannot get carried away with any bearishness.

NYA & VTI
NYA W: Above YR1 is positive but given weekly chart RSI a fade back under the level could happen. Otherwise 2HR1 next level above.
NYA D: Still holding YR1 as support; resistance at Q3R1 and JulR2 like the others.
VTI W: Decent higher highs above YR1. Doing fine, but look at RSI.
VTI D: Also down from near test of Q3R1.