Sectors

If doing this work for a fund, for sure would cover the full array of the SPX sectors. But for trading purposes, I am keeping to SMH semi-conductors, XBI biotechs, XLF financials, and XLE energy. 

I'm not really clear on signals here. But let's keep it simple and hold the SMH short if below the YR1, and see where the other pivots on XLF come in. Likely above 2HP and Q3P and JulP.

SMH
Q: 1 year outside the Q BB and a huge wick. Seems ready to drop.
M: Red bar but not reversal. No RSI divergence.
W: YR1 break.
Sum: Not sure whether it goes lower or recovers the YR1 to act as support. 

1 40 SMH Q.png
1 41 SMH M.png

XBI
Q: To be honest I thought the drop would be more than 3 quarters considering that Q chart RSI. Impressive comeback! Huge RSI & BB divergence setting up though. 
M: The M chart 50MA held over and over, and zoom back to upper BB.
W: No idea what is next move. Between YR2 and YR1. Such a huge gain, but RSI OB first time since 7/2015.

1 43 XBI Q.png
1 44 XBI M.png
1 45 XBI W.png

XLF
Q: Ready to launch or fade depends on point of view.
M: One could say BB and RSI divergence here.
W: Between levels.
Sum: No idea - but if TLT and AGG both under YP, XLF should be going up.

1 47 XLF M.png

XLE
Q: Bearish, below all MAs.
M: 50% done and weak selling invites buyers but jeez, 6 months in a row red.
W: Under YP. 

1 49 XLE Q.png
1 51 XLE W.png

Safe havens

Sum
VIX and XIV, though extended, are still very supportive of risk assets. TLT looks ready to drop, and rising rates would benefit financials most of all and support a rotation move that keeps indexes broadly higher. However, AGG with shorter durations is putting up more a fight, and still above its YP. GLD also looks ready to drop, and though my focus has been equities GDX short could trigger with anything lower than YP.

Bottom line safe havens seem to help support stocks, despite the weak look of stocks and my preference for a pullback as the next move.

VIX
Q: Lowest quarterly close ever at 11.18. Previous was 1993 Q2 at 11.26. VIX buyers at the lower BB.
M: 1/2007 close 10.42, 5/2017 close 10.41. Reversal bar with huge wick is unclear. 
W: Hasn't reached YP this year; not going to see YS1 however. 
Sum: VIX in 2007 was just screaming. VIX in 2014-15 also did well. I 'think' the VIX will be similarly clued in but now that more and more people are watching and trading it, maybe not. Bottom line right now is that pro SPX traders are not too concerned about hedging their longs. 

1 20 VIX Q.png
1 22 VIX W.png

XIV
M: 5 months outside BB, last month price outside but close inside - some divergence!
W: Last November for the election with the XIV bang on the YP, I never could have imagined the move that followed. YR2 held it for a few weeks, but has cleared and held since late April. 
UVXY is a deathtrap, but maybe worth looking at in weeks ahead. 

1 23 XIV M.png

TLT
Q: Tried but failed to reclaim 10MA.
M: Stopped at M20MA
W: Tried to reclaim YP but only 1 week then fail. 
Sum: TLT may open above 2HP and Q3P, but YP resistance is bearish. If stocks have a true risk off move based on trade war or some such, TLT will likely rally back above the YP. If it is a garden variety pullback based on rising rates, TLT will continue lower. 

1 25 TLT Q.png
1 26 TLT M.png

AGG
M: 50% bounce then hit.
W: Still above YP though.
Sum: AGG still holding YP, game not over. We'll see.

GLD
Q: Congestion, no signal. Above rising 10MA, below falling 20MA. Weak selling helps the next move up.
M: Above rising 20, but back under falling 50MA. Weak up, bigger drop. Ball in bear court. 
W: Between levels, 2HP & Q3P will be interesting to see. 
Sum: Charts look weak here, but if stocks get hit GLD should rally. We will see. 

1 30 GLD Q.png
1 31 GLD M.png

GDX
W: 3 holds / recoveries of YP to go nowhere, and lower highs each time. If YP goes it will probably go big. Watching for a trade.

USA main indexes

Due to the way the scripts work in tradingview.com, new pivots won't show until bars open on Monday. So this week I'm going to focus on big picture quarterly and monthly charts, weekly chart with yearly levels only, and perhaps manual calculation on a few key indexes.

Sum
Quarterly charts are in amazing uptrends, all indexes well above all moving averages with impressive upward slopes. RSIs on these charts are *above* previous peaks, which I think will help limit damage on a pullback. Trends have been so strongly up, anything -5% will be seen as a great opportunity.

Monthly and weekly charts with pivots are another story. Most monthly charts show RSI and BB divergence, a classic move before a drop. And most importantly to my view:

SPY testing YR1 but still above - key level to watch
QQQ second fractional move below YR2 - anything lower is bearish, needs to have weekly close above to reduce the threat
DIA just below YR1 after 1 week above the level - anything lower is bearish, needs to have weekly close above to reduce the threat
VTI dropping YR1 after 4 bars weakly above - anyshthing lower is bearish, needs to have weekly close above to reduce the threat

3 of 5 USA mains under YR1/YR2s, and one other testing. I try to keep an open mind and acknowledge the trends, but if you consider the yearly levels in play here, RSI and BB divergences on monthly and weekly charts, it seems to be the market is about to get whacked.

But all this concern will dissipate with big gap and go on Monday, which could easily happen.

SPY Q
Massively above all MAs, RSI higher than 2014 peaks means no divergence. 7 quarters in a row - amazing run. Small wick on current weaker up candle some risk of selling as next move but overall very healthy and still a comfortable long term hold. 

SPY M
Above all MAs since 3/2016. Slight RSI divergence, but to me looks better with RSI above the 70 level. BB (Bollinger band) divergence compared to 2/2017 and 3/2017 tops. Wick and small gain invites selling. Uptrend, but pullback due.

SPY W
Above the YR1, but so far only 1 bar up above this level and since then 4 bars of selling. Still holding as support, and key level to continue to watch. Also note RSI divergence top and starting to roll over. 50 area likely better buy zone along with some pivot level if the YR1 cracks. 

1 7 SPY W.png

QQQ Q
Falling back inside Q BB also invites selling. However RSI no divergence yet, so still comfortable as a long term hold. 

QQQ M
RSI divergence. Coming back inside BB after 5 straight months outside. I 'think' upside limited to BB on any up move early in July if that happens. 

1 9 QQQ M.png

QQQ W
Long term buyers of technology in 3/2016 and, end 6/2016 and 7/2016 have had almost no worries until one week in May 2017, and 2 of the last 3 bars. YR2 second break - anything lower looks bad. Takes a weekly close back above to relieve this threat. 

DIA Q
RSI strong and 2nd close outside BB - wow.  

1 11 DIA Q.png

DIA M
RSI still slightly higher but classic BB divergence on the last bar compared to the highs earlier in the year. Wick invites selling.

1 12 DIA M.png

DIA W
Screaming RSI divergence and slightly below the very important YR1. Why shouldn't this level be as important as the 6/2016 YP hold or the 1-2/2016 YS1 holds? Real chance of significant top with anything lower.

IWM Q
2 smaller up bars and some RSI divergence invites selling. 

IWM M
RSI divergence and BB divergence on the last 2 up bars (highs inside BB, previous highs outside). But at least stronger up on last bar and still above all rising MAs. 

1 15 IWM M.png

IWM W
Between long term levels. 

VTI Q
RSI strong and massively healthy advance in play. 

1 17 VTI Q.png

VTI M
RSI divergence and again, classic BB divergence with small up bar with a wick. The door is wide open for sellers. 

1 18 VTI M.png

VTI W
Break of YR1 after trying to clear and stay above the previous 4 bars. Last weeks to have bearish conclusion on yearly level was 8-9/2016 before the drop. RSI divergence also in play.

Valuation and fundamentals

Regular update on 10 week moving average of 18x forward earnings according to Thomson Reuters plotted with SPX price. Healthy that the slope of the P/E is increasing, but you can see SPX bumped up against this valuation a few times and professional sellers have stepped in each occurrence. 

Citigroup Economic Surprise Index from Yardeni still looks terrible. 

3x2 = 6
-5
Total score +1 on scale of -15 to +15
Markets should be about sideways. I have been saying this for several weeks. 

Flip-flopping Nobel prize winning Yale PhD

If you think my 1 day bullish move back to cautious was bad, check out this guy.

February 24, 2017

SPX 2367, CAPE 28.66

Interviewer: "Should the portion of someone's portfolio that was equities be reduced?"
Shiller: "Yes, reducing your holding of stocks, even for a long term, especially for a long term investor.... we know that when [the CAPE ratio] is this high, the [stock market] doesn't do that great."

May 24, 2017

SPX 2404, CAPE 29.39

"Think back to the 1990s, it went up from 30 to 45, that's a 50% further increase. I'm just saying, that could happen again. ... We have some kind of inspiration, maybe, from the White House, a businessman president. If factors go right and there are tax cuts for corporations, it's not that hard to understand" that [the CAPE ratio could go up 50%] (implying the market would also go up 50%). 

June 29, 2017

SPX 2420, CAPE 29.62

"The Cape ratio... is at unusual highs. The only time in history, going back to 1881, when it's been higher, are a) 1929 and b) 2000. We are a high level, and it is concerning."

Long term bear case

Admittedly this a bit more of a stretch than the long term bull case outlined in the last post. Let's face facts: USA main indexes are in healthy uptrends, 4 of 5 above all pivots, above most weekly moving averages which are all rapidly rising. Other than oil, other key sectors are doing fine. Global indexes are also up and delivering a lot more gains than SPX thus far. So what is the valid bear case?

Without getting into my dabbles in Elliott wave (which have been pretty good btw), the main bear case has to do with central banks. If the bull case is that indexes have made convincing breakouts above prior highs 2013+, the bear case is that this move would not have happened without the trillions of $YELR (dollars, yen, euros, pounds, rembini etc) that were pumped into the system from 2008.

Proponents of ZIRP and QE might say these measures were like training wheels on a bicycle for a youngster. When the kid is old enough to ride, the wheels come off the the journey continues ahead.

Bears would say give me a break, the measures were training wheels, extra stabilizers, cushion on both sides in case of fall, and oh yeah, a motorized cycle so you only had to pretend to pedal! So when all that comes off, there is only one possibility: bike-wreck. To put it mildly.

From the not zero-hedge site Pimco:

What? 25,000 Billion globally? What even is that number? Is it pronounceable? And these accommodations are in process of ending. From the not very bearish Financial Times blog:

Training wheels are coming off. And the stabilizers. And the cushions. And the motor is stopping. Economy will soon have to pedal on its own. The bear case is that this the bicycle will have to take a tumble after getting so much help for so long. 

For now, my take is somewhere in between. Stocks are still in healthy uptrends. But I don't buy the pure bullish conclusion that markets are 4.5 years into 15+ years up without a major drop. I don't know how much the market will drop, when it does; but think we will see a major decline decline (-20% or more) sometime in the next 4 years.

For now, ideal scenario remains: relatively mild pullback ~5% or so, then back up to test highs, then we shall see.

ps: So far markets have ignored crazy man at the wheel but you just never know when that is going to get real.

Long term bull case

As the end of the first half approaches, I am going to write a couple of posts on the larger picture. 

First, what are the basic bull and bear cases for risk assets? This post considers the bull side. 

Bull case
Major USA indexes have broken out of multi year consolidations to upside, and could be just in early phases of a major run. Here is the SPX quarterly chart with consolidation from 2000-2013. This means the breakout move is just 4.5 years old. 

And this year, the big 2000 top in tech has been taken out in a very convincing fashion after several quarters of stall. 

Using the Dow to go further back in price history, the last consolidation before this from 1966 top to 1982 real breakout was 16 years, followed by an 18 year mad bull stampede into the 2000 top. 

27 2 INDU Q.png

Lastly, the 1929 top was not cleared until 1954, 25 years. Still, that was only a portion of the way to the 1966 high even though the market had increased substantially off Depression and WWII major lows. We could also consider the breakout above the 1930s highs (first in 1946 was fake-out) followed by breakout for real in 1949 - 20 years after 1929 peak and 12 years after 1937 high. 

27 3 INDU Q.png

Also consider RSI on these charts in the lower panels. SPX RSI reached above 70 in 2013 Q3, and since then the low has been 65 in 2015 Q3. This is what happens in bull markets. Current reading of 79 is still well under 1998 top of 95. 1950s bull market quarterly chart RSI on INDU reached up to 90, still considerably higher than today. Also, that was just the first in a series of peaks until the 1966 top. Current charts do not show any divergences on quarterly chart RSI which tend to precede major tops in the market except on parabolic bubble tops like 1929. 

It is safe to say that 4.5 years beyond and 50%+ above the 2000 top on SPX, and 6 months and approximately 20% above the 2000 top in NDX, that the current move is not a fake-out. From these examples, one could conclude the bull market is in early phases and should have plenty of room to run. At the very least we are likely to see quarterly chart RSIs go higher, then show divergence, before a major bull market high. This would imply many more quarters of upside. 

Soon: the bear side. 


Total market view

REVIEW
6/18/2017 Total market view: "It is not every week that 3 of 5 USA mains are at yearly resistance and so happens that bonds are at yearly pivots. Watch, and if the market makes a "ring the bell" sort of move with VIX and XIV confirming, take meaningful action."

QQQ recovered YR2 and DIA held YR1 throughout last week. 

Sum
The market is in an odd state: all 5 USA mains are above all pivots, VIX below all pivots, XIV above all pivots. This remains a bullish configuration for risk assets. There is only slight daily moving average weakness with SPY and VTI below 10 & 20, and DIA testing 10. Others, meaning QQQ and IWM, above all MAs.

Yet TLT is above all pivots and GLD just regained that status as well. How is this happening for all USA stock indexes and 2 key safe havens to be this strong as well? I don't know. I thought market was very ripe to see a drop from Dow YR1, especially considering valuation and fundamental concerns, but so far that hasn't happened. I remain watchful and wary, but thus far any defensive move has not paid.

Bottom line
So far stocks holding up well. I have been expecting a drop from DIA YR1 but so far it hasn't happened.

Soon heading into the second half which means the most change in pivots other than the new year - new second half (2H), third quarter (Q3) and of course July levels for pivots, resistance and support. Often definitive moves begin near the start of quarters. Will tech and global indexes have a re-balancing move? Will energy, financials and small caps gain? Will TLT continue to gain or pull back? As the new quarter approaches, it often pays to do a full analysis of quarterly and monthly charts. 

Positioning
Currently 80% long. I thought the 3rd break of June pivot for QQQ would seal the deal for a pullback but no. If markets continue up on Monday I may add back to 100% but likely on SPY as I think the biggest winners will be more subject to profit taking in weeks ahead. 

PIVOTS
USA main indexes - DIA above YR1, VTI also back above YR1, QQQ back above YR2 and reclaimed above all pivots. Unlike other times this year, IWM doing fine too. All bullish action but I'm still watching Dow YR1 at 21350 cash.

Safe havens - VIX and XIV still very bullish for risk, but at the same time, both TLT and GLD above all pivots. Weird!

Global indexes - Benchmark ACWI biggest drop in weeks, with FXI, INDA and KWEB a bit off highs. EWZ and RSX have been dragged lower with oil, and SHComp in its own universe recovering in June from May weakness.

Sectors of note - XLK testing YR1, with high bang on 1HR3. 

Currency and commodity - Oil via USO slight break and recovery of YS1 - potential speculative buy. DXY remains below all pivots despite recent bounce off 1HS1.

OTHER TECHNICALS
Time to pay attention to quarterly and monthly charts. Small up bars can invite selling. 

VALUATION AND FUNDAMENTALS
Valuation healthy, fundamentals not. Stocks ignoring USA economic data but bonds are paying attention with TNX near 7 month lows. 

SENTIMENT
No recent extremes - early June bullishness on 2 meters has been worked off.

TIMING
Proprietary work in progress model that I quietly persist in pursuing due to calls like this from three weeks ago:

"In addition, a larger timing cycle points to momentum slowing in risk assets from 6/5 into July."

QQQ, the main index momentum leader, fractionally higher on 6/8 then slammed. 

This timing work used to be more of a focus when I worked for a small hedge fund, but I just don't have the time to properly devote to it now. Still, given timing, I would rather see some topping process then more of a risk off move. 

June dates (published in 5/29 Total market view)

6/9 - SPY price high
6/15-16 - DIA price high 6/14 (-1)
6/21-26 - TBD, prefer down for stocks especially the hot trades of 2017 (TBD)

Positioning

Came into week 100% long with no hedges or shorts.

Current
1 QQQ (12/7)
2 EEM (3/13 & 4/3)
2 SPY (4/17)
1 KWEB (4/20) nice idea, better to have more
4 SPY (4/24 & 5/23)

Adjustments
6/20: Out of QQQ and KWEB, so far mistake. 

8 longs or for 80% net long.

These have been great winners and only issue has been not having more. Took gains on expected re-balancing profit taking but so far looks like error. 

*

Positioning information
1 position represents 10% of capital.
Limits: 15 or 150% long, -50% shorts, hedges or safe havens, 200% max total exposure.
Currency & commodity positions are not included in this system.

Oil

When analyzing oil, first there is the choice of chart: Current month contract, continuous contract or ETF. I tend to prefer the latter two. 

Sum
While CL1 contract is not a screaming buy, USO looks like a decent speculative buy setup based on: Monthly chart Bollinger band and RSI divergence and just as important 2017 YS1 hold. I don't know if this will get far but if not short (as one could be on USO from 4/20 on) then this is the kind of place to try a rare counter-trend move. Note: I mention these only rarely because the easier money is usually with the trend. 

CL1
Huge hold of YP on 5/5, back up to near Q2P, then down from there this time breaking YP, below 1HS1 and now testing Q2S2 with RSI oversold for the 4th period of trading days this year. 

Based on this it is hard to make too much case for a buy.

24 20 CL1 D.png

USO
But this looks more interesting from a speculative view. RSI is bang on 30 with nice divergence from previous lows, and price dropping onto monthly Bollinger band with rising slope. 

24 21 USO M.png

Also, just held YS1 for 2 days. This is what lows look like. 

24 22 USO D.png

Safe havens

Sum
VIX and XIV below all pivots / above all pivots respectively. XIV level that had acted as resistance for the last several weeks on XIV cleared last week.

Interestingly, other safe havens TLT and GLD also above all pivots. Odd considering that all 5 USA main indexes are also above all pivots! Something should give but until VIX/XIV confirms trouble, better to hold stocks. With strength in TLT and GLD however, a leveraged long position at this point would be unwise. 

VIX
Stayed under all pivots all month despite a few slights from Q2S1. Bullish for risk assets below all pivots. Also note other stock index buy points at 1HP pivot tests in mid April and mid May.

24 10 VIX D.png

XIV
Cleared 1HR3 after being stuck at this level for several weeks. Bullish. 

TLT
Back above YP / 1HP and above D200MA to boot. 

24 12 TLT D.png

AGG
Also above YP / 1HP and D200MA mostly since the end of May. Lately resistance at Q2R1.

24 AGG D.png

GLD also back above all pivots!

GDX
Just held YP and back above JunP. Still below D200, Q2P and 1HP. 

24 AGG D.png

USA main indexes

Abbreviated version with 1 chart per index.

Sum
Bulls still in charge with no sign of selling from key levels. DIA holding above YR1 throughout, and VTI recovered YR1 on Friday after 2 day slight break. QQQ back above all pivots as of 6/21. and basically holding YR2 as support with just 1 day fractional break in June. SPY well above its YR1 and also holding above Q2R1. IWM also above all pivots and nearly testing Q2R1.

Anything lower would look significant with YR1 rejections on DIA and VTI, but that hasn't happened. yet.

SPY
Well above YR1 which cleared and held 5/25-31, and then mostly above Q2R1 from 6/1 which has held as support on several tests. Overbought condition of 6/2 has worked too to RSI 53 on 6/22 with minimum of price damage. Still bullish here. 

QQQ
3 breaks of JunP and 3 recoveries. Held YR2 as support, back above 1HR3 as well. Testing Q2R2.

24 6 QQQ D.png

DIA
Top near 1HR2 so far, but still above the more important YR1. Also holding Q2R1 as support. Almost anything lower would be below YR1 so this is still the level to watch. 

24 7 DIA D.png

IWM
Above all pivots, nearly testing Q2R1 again. Doing fine this month.

VTI
2 days slightly below YR1 but recovery on Friday keeps the weekly bar above. 

Valuation and fundamentals

Ten week moving average of SPX forward earnings continues to climb, making 18x that level up to 2462. This is a fully valued market but the upward slope is still a decent positive. Valuation level in blue and in orange in the graph below. Scoring 3.

Citigroup Economic Surprise could not be worse. It looks so bad some smart people have started to think it can only go up from here. Score -5.

3x2 (double weighted) = 6
-5
Total 1 on scale of -15 to 15.

Markets should have limited upside based my reading of these indicators. 

Total market view

REVIEW
6/11/2017 Total market view: "Basic configurations remain supportive for stocks - all 5 USA main indexes above all pivots, VIX below all pivots, XIV above all pivots. However, with momentum stocks getting slammed and Dow testing YR1 area it is a week to be watching carefully."

Thus far Dow not seeing any selling from the YR1 level, and portfolio made no adjustments last week.

SUM
3 of 5 USA main indexes and safe haven bonds (TLT, TYX & TNX) are at yearly levels. Dow at YR1, VTI also near YR1 and QQQ back to YR2. Meanwhile, TLT, TYX and TNX all testing YPs. These are the levels to watch this week, especially considering the historical importance of Dow yearly levels as outlined in this post. See below for actual numbers.

I think that bond strength will increase chance of stock drop, while bond weakness increases the chance of stocks continuing to trade above levels and/or not much damage on declines.

As we head into the last 2 weeks of the 2nd quarter / 1st half, it is still possible to have re-balancing out of the hottest trade and money into sectors like energy. This would imply risk to tech, semi-conductors, Europe (which I don't track too much here) and global indexes. 

Bottom line
It is not every week that 3 of 5 USA mains are at yearly resistance and so happens that bonds are at yearly pivots. Watch, and if the market makes a "ring the bell" sort of move with VIX and XIV confirming, take meaningful action.

Positioning
So far still holding tech and EEM for 100% long even though wary of further re-balancing. If tech and global stocks drop further with other indexes holding up, shifting out of QQQ & EEM into SPY might be smart.

PIVOTS
USA main indexes - Dow at YR1 21350 with 1HR2 21428 just above: NDX back to YR2 5684; VTI slightly above YR1 124.88. Also, QQQ JunP in play at 139.66.

Safe havens - TLT at YP 126.51. GLD at JunP. VIX and XIV still below/above all pivots respectively.

Sectors of note - SMH weaker with XL bouncing without any move in oil points to the re-balancing idea. 

Global indexes - ACWI, FXI, EEM still above all pivots. KWEB fractionally below JunP. SHComp above YP & 1HP, below Q2P. EWZ weaker, RSX still above YP but well below all others.

Currency and commodity - DXY recent low bang on 1HS1. DXY strength would pressure global indexes or at least increase the chance of a rebalancing drop. Oil below all pivots via CL current and USO for a few weeks; CL1 finally cracked its YP so below all pivots on 6/15-16.

OTHER TECHNICALS
E-wave idea of market structure not qualitative but interpretation has been mostly correct. Are we about to see end of weekly wave 3? If so, what is next? Check out the post and then click on tag for series here.

RSIs for SPY reached above 70 on all timeframes recently, but so far working off condition with minimal damage to price.  
Q 79.0
M 74.0, no divergence
W 67.6, down a bit from recent high 71.8 reached 5/29 bar
D 54.8, so far working off higher readings of 70.3 reached 6/2 and tested 67.9 on 6/13 without much drop in price. Watching 50 area for reaction.

VALUATION AND FUNDAMENTALS
SPX at 18x forward earnings but with earnings increasing, price can continue to climb higher without getting truly more expensive. But Citi Economic Surprise looks terrible and should present at least some risk to the market. 

SENTIMENT
Extremes reached on 2 of 4 meters I track reached early June, but these also working off.

TIMING
Proprietary work in progress model that I quietly persist in pursuing due to calls like this from two weeks ago:

"In addition, a larger timing cycle points to momentum slowing in risk assets from 6/5 into July."

QQQ, the main index momentum leader, fractionally higher on 6/8 then slammed. 

This timing work used to be more of a focus when I worked for a small hedge fund, but I just don't have the time to properly devote to it now. Still, given timing, I would rather see some topping process then more of a risk off move. 

June dates (published in 5/29 Total market view)

6/9 - SPY price high
6/15-16 - DIA price high 6/14 (-1)
6/21-26 - TBD, prefer down for stocks especially the hot trades of 2017

E-wave

In the last Elliott wave update from 5/17, I thought we had seen the end of a weekly wave. but this turned out premature.

But the larger point remains - if this idea of structure is right, then upside is limited because following completion of weekly wave 3 is wave 4 pullback, then wave 5 to end the move from the 2016 low. If I am right about the monthly structure, the end of this weekly series will also be the end of the 2009 move. I know, bearish. 

I can also acknowledge that 2013 was a huge breakout of multi year/decade range for SPX, and NDX followed in 2017. These moves might be stronger than E-wave idea that finishes in 2017-18. But this far my E-wave projections have mostly turned out pretty well. 

March 2016 projected 2250-2500 SPX top 2017 Q2 to 2018 Q2, when SPX was at 2050 - ding!
Late June 2016 said "If all this is correct then we are about to get the last best move of the bull market over the next year or two" - ding!
January 2017 said: "According to this view, top callers are pre-mature here. Strength begets strength as Wall Street drools over tax cuts, stimulus, and money coming out of bonds. This is what euphoria looks like." - ding!
Early 2017 March said: "So, the issue here is even if we just saw a decent trading top, what is next is a wave 4 and this is more likely to be sideways and drawn out in time." - ding! SPX sideways without much damage for nearly 3 months as next move.
Mid March said: "Take note: if model is correct, the remaining up portions of this bull market are limited to: w5/W3 on weekly SPX chart; W5 on weekly SPX chart; Finito."

So here is the weekly structure with up portions in green. Not shown are W4 and W5 to complete. 

Look at this, within the larger Wave 3, w5 subdivision = 61% of w1 nearly exact. These things happen!

If this idea is right, then the next moves are more like this:

Wave 4 would approximately match damage of W2 which at current highs projects to 2317, or about a -5% drop. 

Positioning

Came into week 100% long with no hedges or shorts.

Current
1 QQQ (12/7)
2 EEM (3/13 & 4/3)
2 SPY (4/17)
1 KWEB (4/20) nice idea, better to have more
4 SPY (4/24 & 5/23)

Adjustments
None

*

Positioning information
1 position represents 10% of capital.
Limits: 15 or 150% long, -50% shorts, hedges or safe havens, 200% max total exposure.
Currency & commodity positions are not included in this system.

Safe havens

Sum
VIX and XIV remain supportive of stocks. The VIX highs of 2017: 3/27, 4/12-17, 5/17-18, 6/9-12 and again 6/15 have all been on pivots at MarR2, 1HP, 1HP, Q2P and JunP respectively. 

But TLT (along with related yield charts TYX and TNX) testing YP / 1HP combo which is a huge level for markets. Bond strength ie yields down was not in the Wall Street script for 2017 and the TNX that began the year near 2.50, already off the highs of 2.62, as dropped all the way to 2.10 just last week and still just barely off the lows at 2.15. I think if the market goes in the direction of bonds (TLT above YP, TYX and TNX below) then stocks will be more at risk for a drop.

GLD mostly range bound and turning nicely on pivots this year. Currently on JunP, also a level to watch. 

VIX
VIX remains below all pivots and daily MAs. Recent test of JunP and Q2P was the high for the month on 6/12. If stocks were to put in a real correction, we would see VIX above the Q2P at least and possibly the 1HP (which was the highs in mid April and mid May).

In charts not shown VXN has been above the Q2P since 6/5 and did a great job on warning of tech drop. Otherwise only VVIX (VIX of VIX) is above any pivots. VXD (Dow VIX), RVX (Russell), VBEM (Emerging mkts), VXV (3 month) all below all pivots. 

XIV
Again up to 1HR3 - the highs on 5/16, 6/5, 6/9, 6/13, 6/14, 6/15 and 6/16. 

TLT
Testing YP / 1HP combo. TYX and TNX are doing the same. I think if the market goes in the direction of bonds (it TLT above YP, TYX / TNX below) then stocks should be more at risk for a drop.

18 24 TYX D.png
18 25 TNX D.png

AGG
Already above YP for the second time this year since 5/30.

GLD
Turning on pivots. Testing JunP now. 

18 31 GLD D.png

GDX
Just cannot get going on the long side when GLD shows strength - and another rejection at the D200.

18 32 GDX D.png

USA main indexes

Sum
Crucially, INDU set is holding above YR1 with no sign of rejection thus far. VTI is also holding above its YR1, as it has for the last 11 trading days. Market leader QQQ broke its JunP for the second time this month, and has dropped down to its YR2 as well. These are the major long term levels to watch this week, and so far the conclusion is bullish - no selling pressure. However, weekly charts and daily RSIs to me suggest break. It is again a week to pay attention.

SPX / SPY / ESU / ES1
Some extra charts today. 
SPX W small up bar.
SPY W 2 small red bars ready for up on Monday.
SPY D no rejection from Q2R1.
ESU on buy but momentum slowing after reaching RSI OB on 6/2.
ES1 showing contracting BBs.
SPX set sum - Above all pivots and MAs except 10. So far RSI overbought working off with minimal damage to price. 

17 2 SPX W.png
17 6 SPY W.png
17 7 ESU D.png
17 9 ES1 D.png

NDX / QQQ / NQU / NQ1
NDX back under YR2!
COMPQ high bang on YR2.
QQQ W also still holding rising 10MA, looks fine.
QQQ under JunP.
NQU MACD on sell but above rising D50MA.
NQ1 back to lower daily BB - huge buy points in last several months. 
NDX set sum - NDX back under YR2! This is big news and key level to watch ahead. Daily charts don't look terrible though, so far holding D50 and near lower BB. Buyers could easily step back in.

17 13 QQQ D.png
17 10 NQU D.png
17 15 NQ1 D.png

INDU / DIA / YMU / YM1
INDU W testing YR1 / 1HR2 combo but no rejection yet!
DIA W pushing the top BB and RSI higher than 4/24 week - bullish.
DIA D no selling from levels yet.
YMU smooth up.
YM1 also 3 days above YR1!
INDU sum - Testing YR1 / 1HR2 levels and so far pushing through with no sign of selling. 

17 17 DIA W.png
17 18 DIA D.png
17 19 YMU D.png

RUT / IWM / RJU / RJ1
Weekly chart still between long term levels.
IWM W down from upper BB; sometimes, but not always, the start of real pullbacks.
IWM D Q2R1 rejection.
RJU above rising 20MA.
RJ1 another failure at 3/1 highs. 
IWM set sum - Not the worst above all pivots and above all MAs except D10, but reversal from weekly BB could turn into a larger drop.

17 24 RJU D.png
17 25 RJ1 D.png

NYA & VTI
NYA nearing 1HR2 then YR2. 
NYA W looks like a top.
NYA D on Q2R1 but no rejection.
VTI holding a bit above YR1.
VTI W looks like a top.
VTI D shows 11 trading days holding YR1, but not going higher. 
NYA VTI doing fine with no sign of selling; but weekly charts, daily RSIs and inability to lift above YR1 to me looks like break will be the next move. 
 

17 27 NYA W.png
17 29 VTI W.png
17 30 VTI D.png

Valuation and fundamentals

The 10 week moving average of 18x P/E is moving up with impressive slope (blue line). SPX price (orange) has bumped up against this valuation level a few times, but with earnings increasing the index can continue to climb without becoming truly more expensive. A healthy 3 on scale of -5 to 5.

*

Citigroup Economic Surprise Index got even worse. C'mon. I cannot believe the market is reacting somewhat to this. Well, stocks have been ignoring, but not bonds. TNX and other yields at multi-month lows on 6/14.

I would like to see the indexes on Europe, Japan, China, Emerging markets, etc, that are available on a Bloomberg but not publicly released as far as I know. 

The conclusion has to be that markets are moving more on earnings than economic releases, which makes some sense. Or global economy is doing better than USA, which is certainly possible. Either way I think i may have to downgrade the "fundamentals" portion of my scoring. To keep it simple will give the P/E double the weight of the Economic Surprise.

Valuation: 3x2 = 6
Fundamentals: -5
Total score 1 out of -15 to +15 scale. Seems like market should not have much upside. 

Total market view

REVIEW
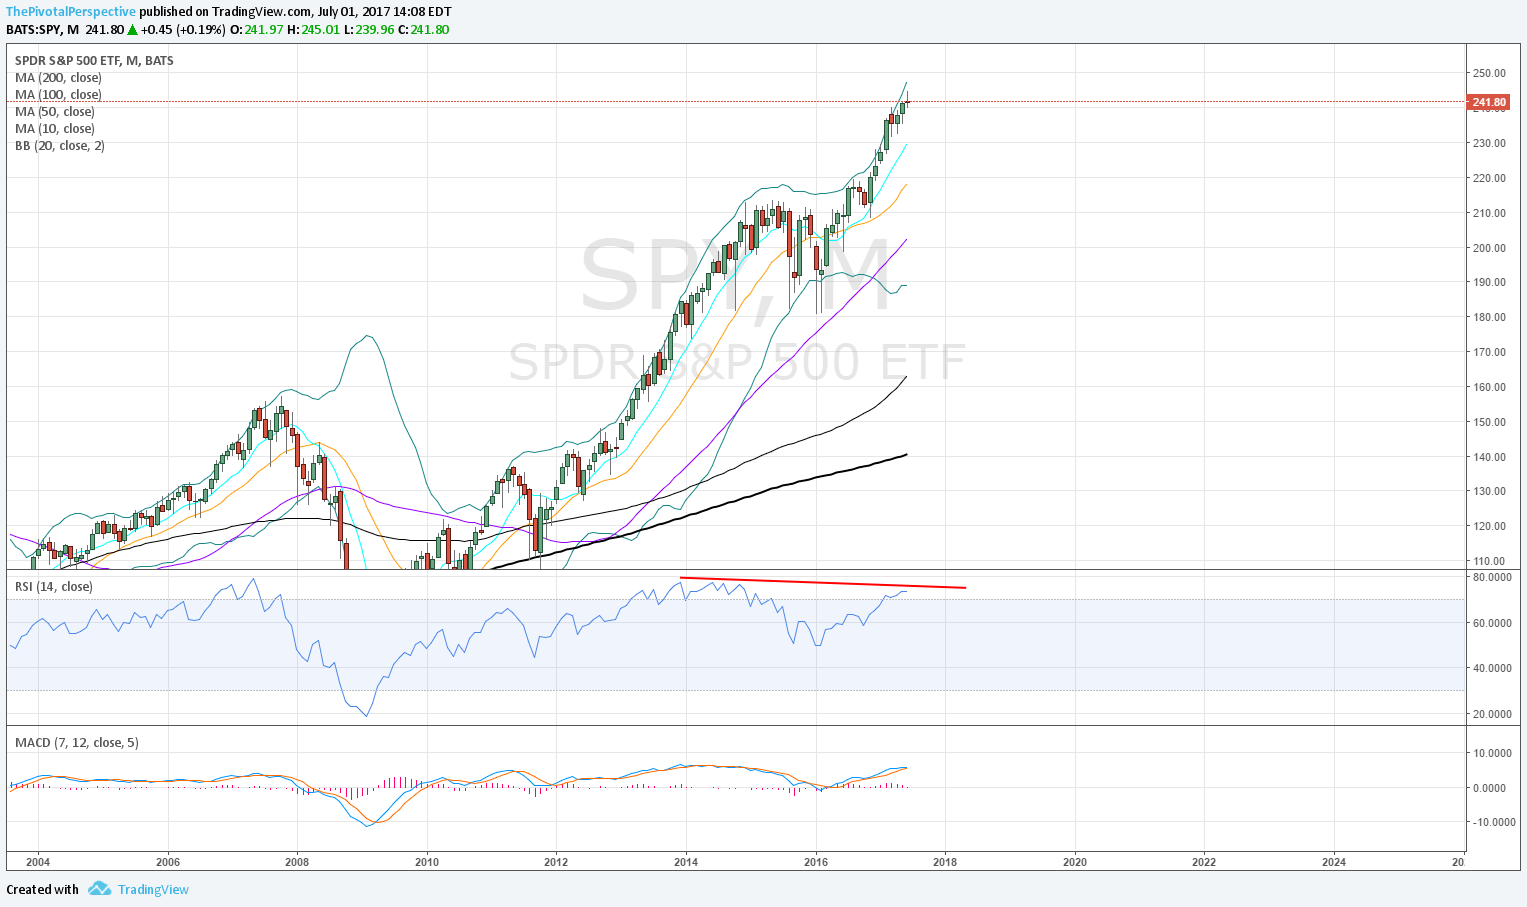
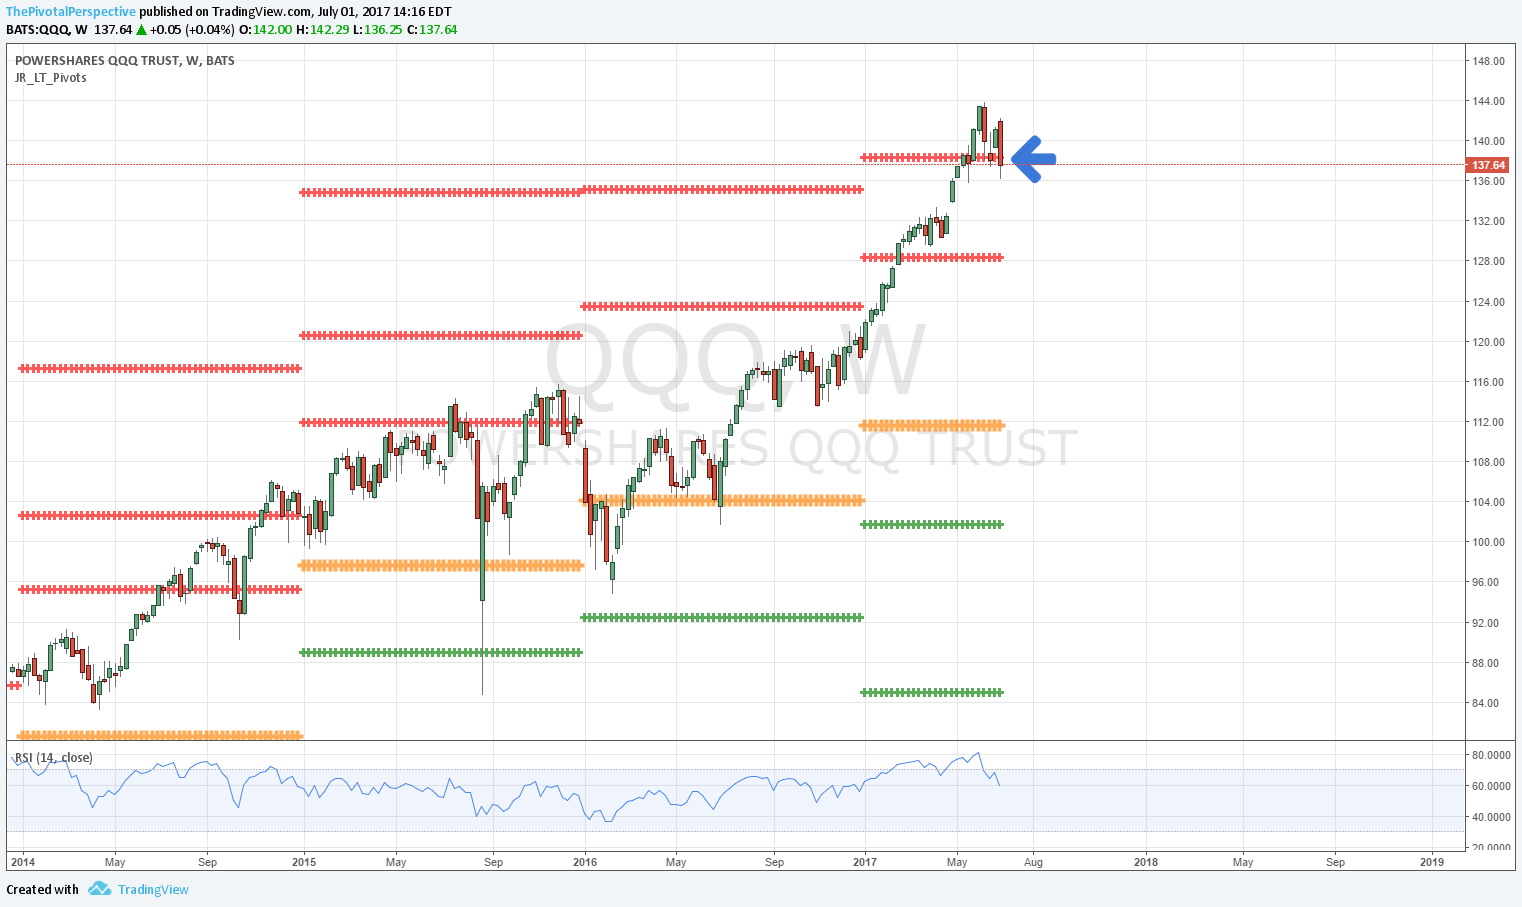
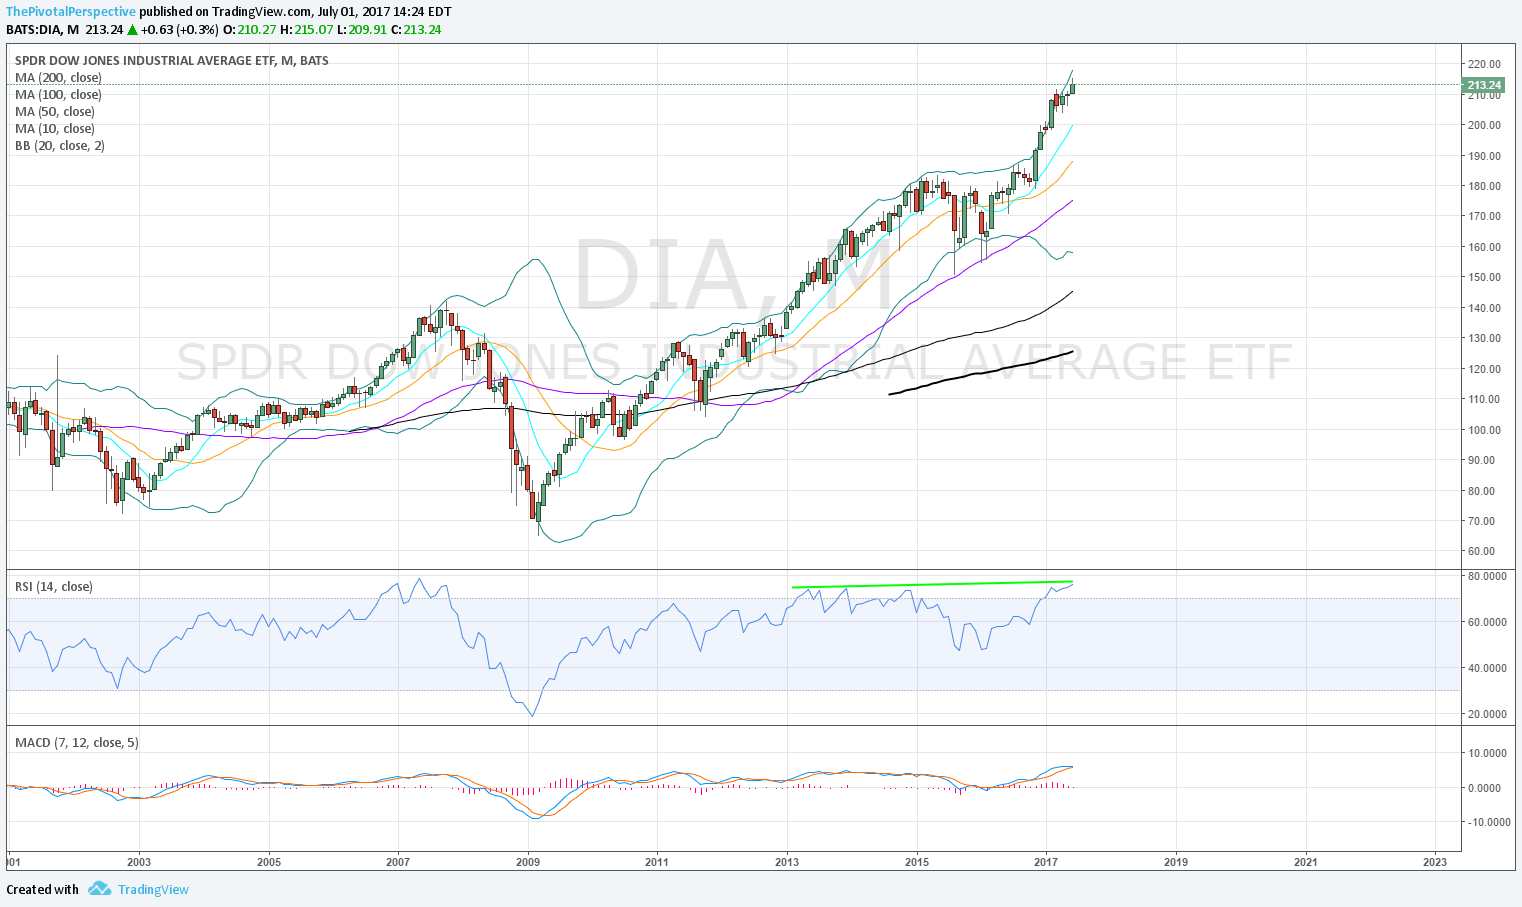
From 6/3/2017 Total market view: "All 5 USA main indexes are above all pivots, with VIX below all pivots (and not showing any caution signs) and XIV above all pivots. This basic configuration is very bullish for risk assets. In addition, 3 of 5 USA mains just cleared significant levels - QQQ jumped above Q2R2, and even more important, SPY cleared YR1 and VTI traded above YR1 for one day. Tops begin with rejections - not clearing - of levels. As long as these maintain, markets are doing fine. Next to watch will be DIA set YR1 area. ... Another thought - at some point in June we may see professional re-balancing move. This would imply tech slowdown and and possible bid in energy, the weakest S&P sector this year. Not sure where IWM & XLF fall in this picture however."

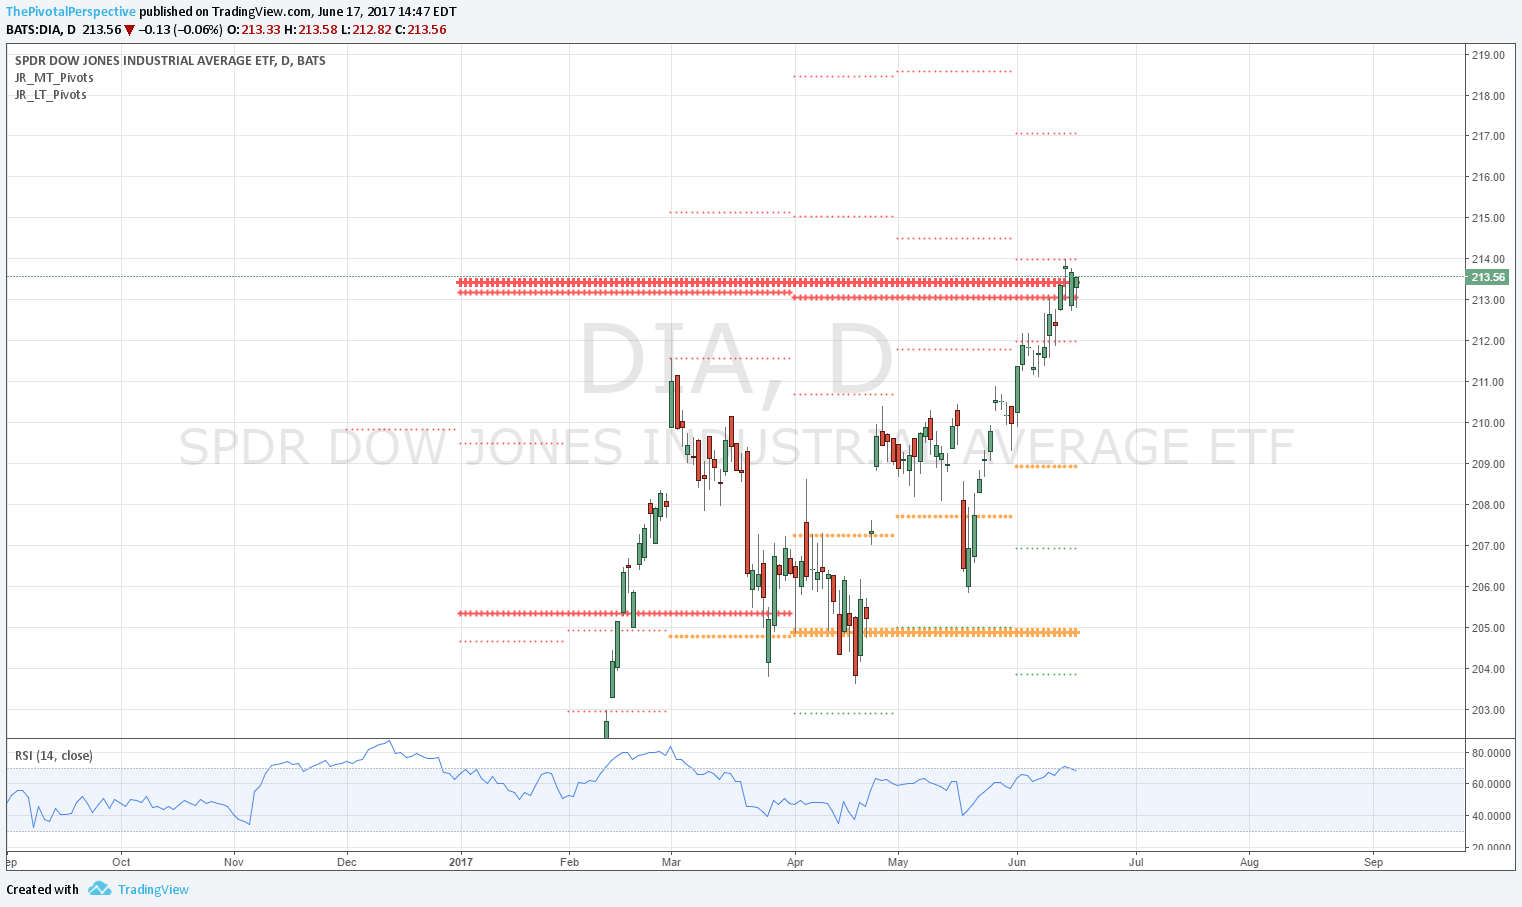
Most indexes continued up, with DIA nearly reaching YR1 last week. Tech cracked and energy (XLE) jumped on Friday.

SUM
Basic configurations remain supportive for stocks - all 5 USA main indexes above all pivots, VIX below all pivots, XIV above all pivots. However, with momentum stocks getting slammed and Dow testing YR1 area it is a week to be watching carefully.

Given the disparity between tech gains and energy losses, I think there could be more to recent moves given likely institutional re-balancing near the end of the second quarter.

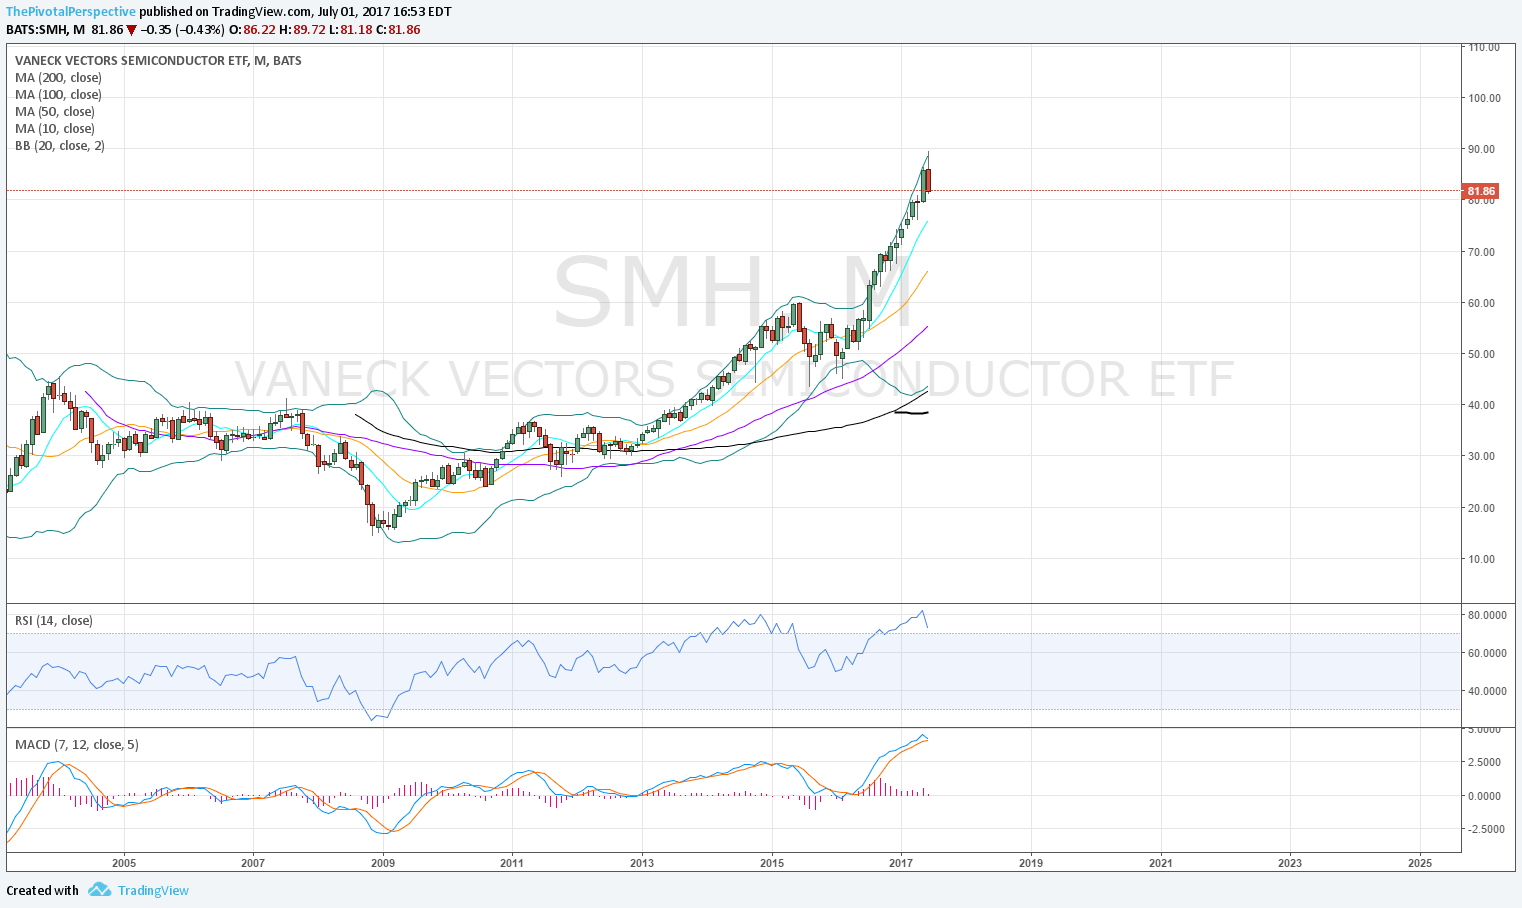
Several indexes are mixed in the sense of above/below all pivots, but also moving from support/resistance levels indicating key turn more likely and change in trend enough to matter in the near future. For example, VIX below all pivots yet moving up from Q2S1; XIV above all pivots, but moving down from 1HR3. This is also true of QQQ, SMH, COMPQ, KWEB, ACWI, GLD, DXY (almost), EURUSD (also almost), and others all on various support/resistance levels. In this list I am referring to quarterly, half-year and yearly levels only (not just monthly). 

Bottom line
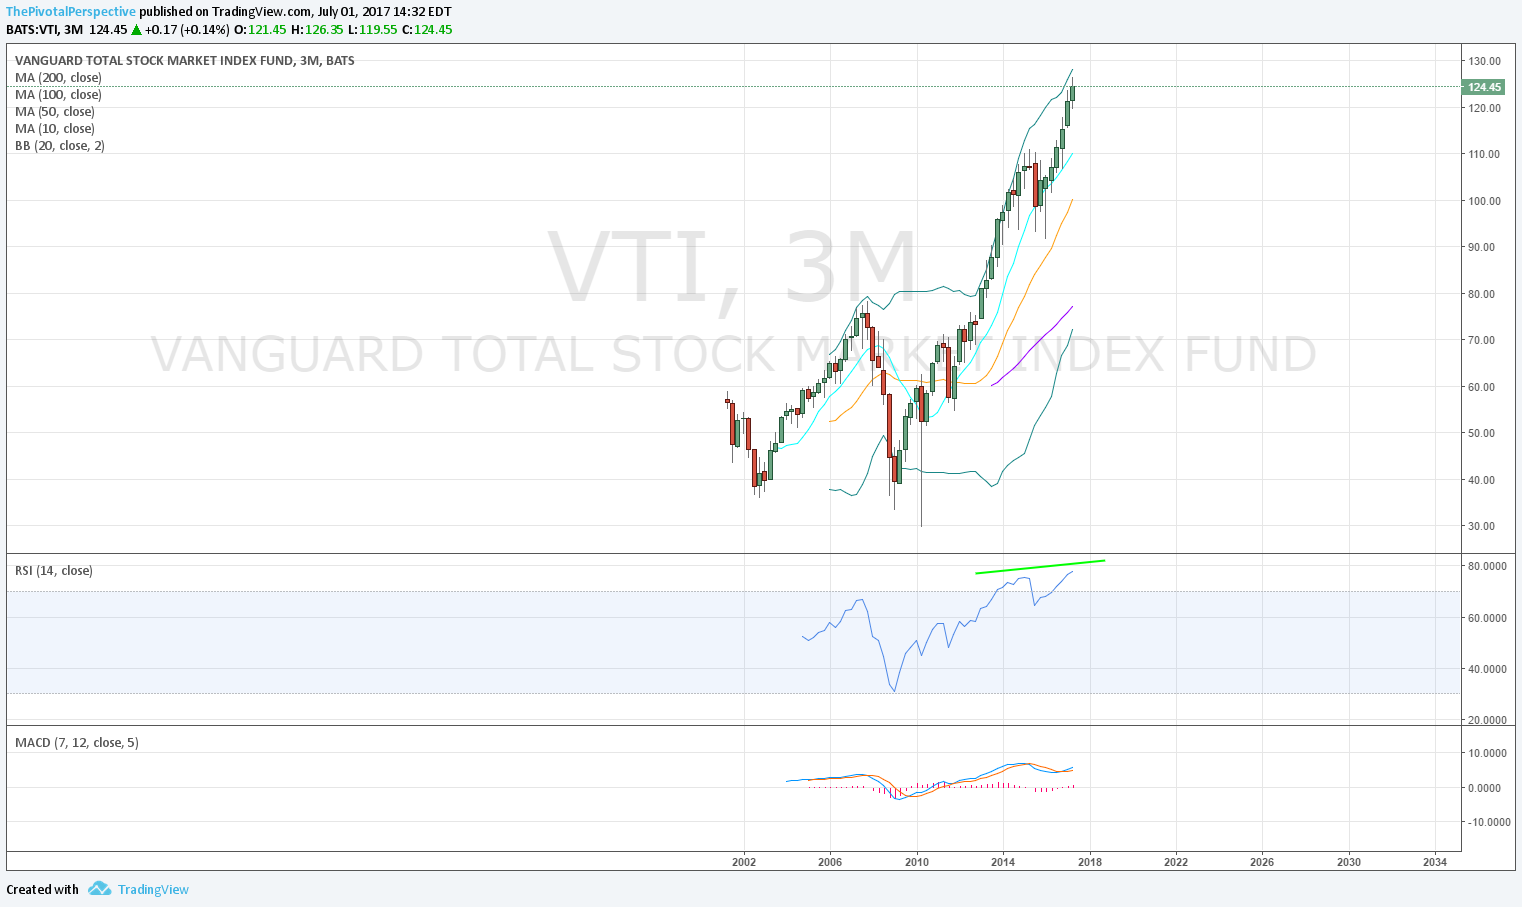
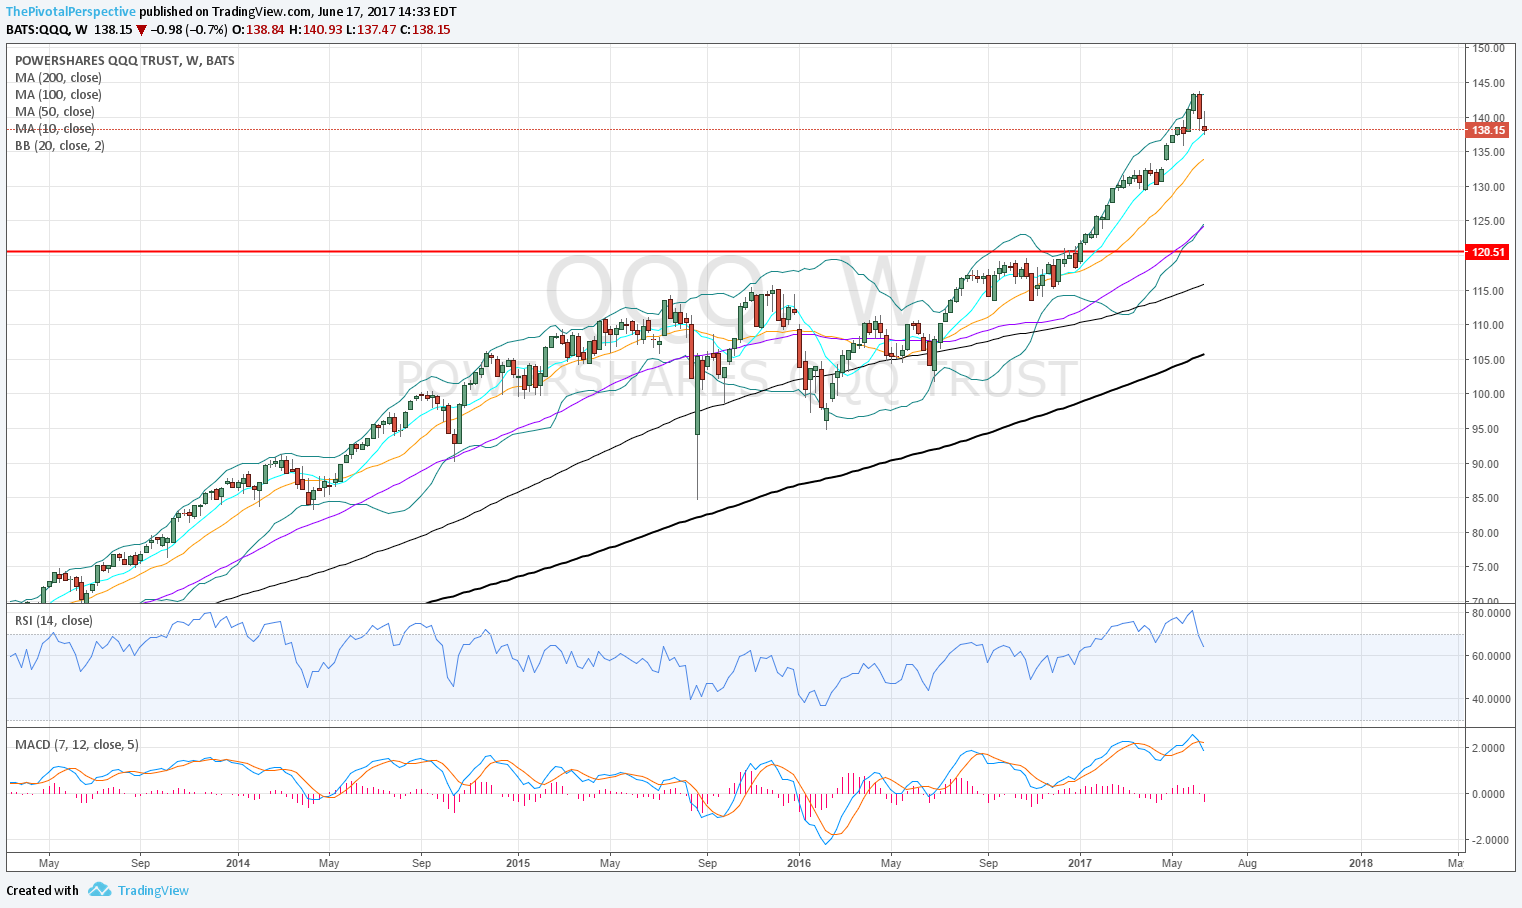
In 2017 stock bulls have been in charge with QQQ powering up through YR1 and then above YR2, SPY clearing YR1, VTI just clearing YR1, and now DIA testing its YR1 too. Will it join the others by clearing the level or will market turn here? I don't know, but can show the history since 2005 of many market turns on Dow yearly levels. It is time to pay attention. The market would remain in a stronger state if QQQ & and SMH hold above all pivots; but we also might see rotation with tech slowing and financials continuing to jump on rising rates.

If the market makes a true risk off move, it will be more than just tech dropping. We will see changes of pivot status in VIX, XIV and likely GLD will remain stronger. Bonds typically do well in risk-off environments, but may given the FOMC a stock correction on rising rates is possible.

I don't mean to sound unclear but sometimes markets have mixed signals and that is what is going on here. We don't have to jump the gun. Often definitive moves begin near near the end of quarters or beginnings of new ones, so if there is not a good setup or definitive move on Monday then it is likely one will become clear soon enough. 

Positioning
Back to 100% long with small counter-trend loss, but I may try again via short on Dow YR1. 

PIVOTS
USA main indexes - Dow YR1 test. QQQ slammed but still above all pivots.

Safe havens - VIX and XIV still supportive of risk. Interesting move on VXN. 

Sectors of note - XLF above Q2P for the first time all quarter on Friday. 

Global indexes - ACWI, EEM, FXI INDA, KWEB all above all pivots. SHComp just reclaimed YP for the 3rd time since breaking in May. EWZ and RSX weaker. Of the indexes above all pivots, ACWI high on Q2R2 but others not on levels or monthly levels only.

Currency and commodity - DXY almost made first target of 1HS1, missing by .22. Still below all pivots though. DXY strength would likely pressure global indexes. CL continuous contract back to key YP support. Any lower bearish for oil despite my idea of energy supported soon due to re-balancing.

OTHER TECHNICALS
Last week I pointed out RSI overbought on SPY across timeframes. Weekly RSI dropped down to 69.7, and daily to 63.67. Ultimately I think we will see RSIs lower, but near term room for daily chart to revisit highs.

VALUATION AND FUNDAMENTALS
Earnings estimates doing great and jumping in the last few weeks for SPX. But economic data continuing to come in under expectations has to take some toll at some point.

SENTIMENT
2 of 4 meters I track at extremes a couple of weeks ago, but so far stocks still doing fine.

TIMING
Proprietary work in progress model that I quietly persist in pursuing due to calls like this from a week ago:

"In addition, a larger timing cycle points to momentum slowing in risk assets from 6/5 into July."

QQQ, the main index momentum leader, fractionally higher on 6/8 then slammed. 

This timing work used to be more of a focus when I worked for a small hedge fund, but I just don't have the time to properly devote to it now. Still, given timing, I would rather see some topping process this week then more of a risk off move. 

June dates (published in 5/29 Total market view)

6/9
6/15-16
6/21-26