Sum
NDX, SPX and NYA are testing resistance levels - YR2 and QR1s respectively. 2018 winners NDX and RUT haven’t done much in Sept and both again testing MPs. However, DJI soared above YR1 last week which should alleviate the concerns about a major trading top.
Bottom line - More charts at resistance along with daily and weekly RSIs at or approaching overbought suggest pullback, but DJI lifting above YR1 helps reduce the chances that we just saw a big top. Translation - pullback then another lift the most likely move.
SPX SPY ES
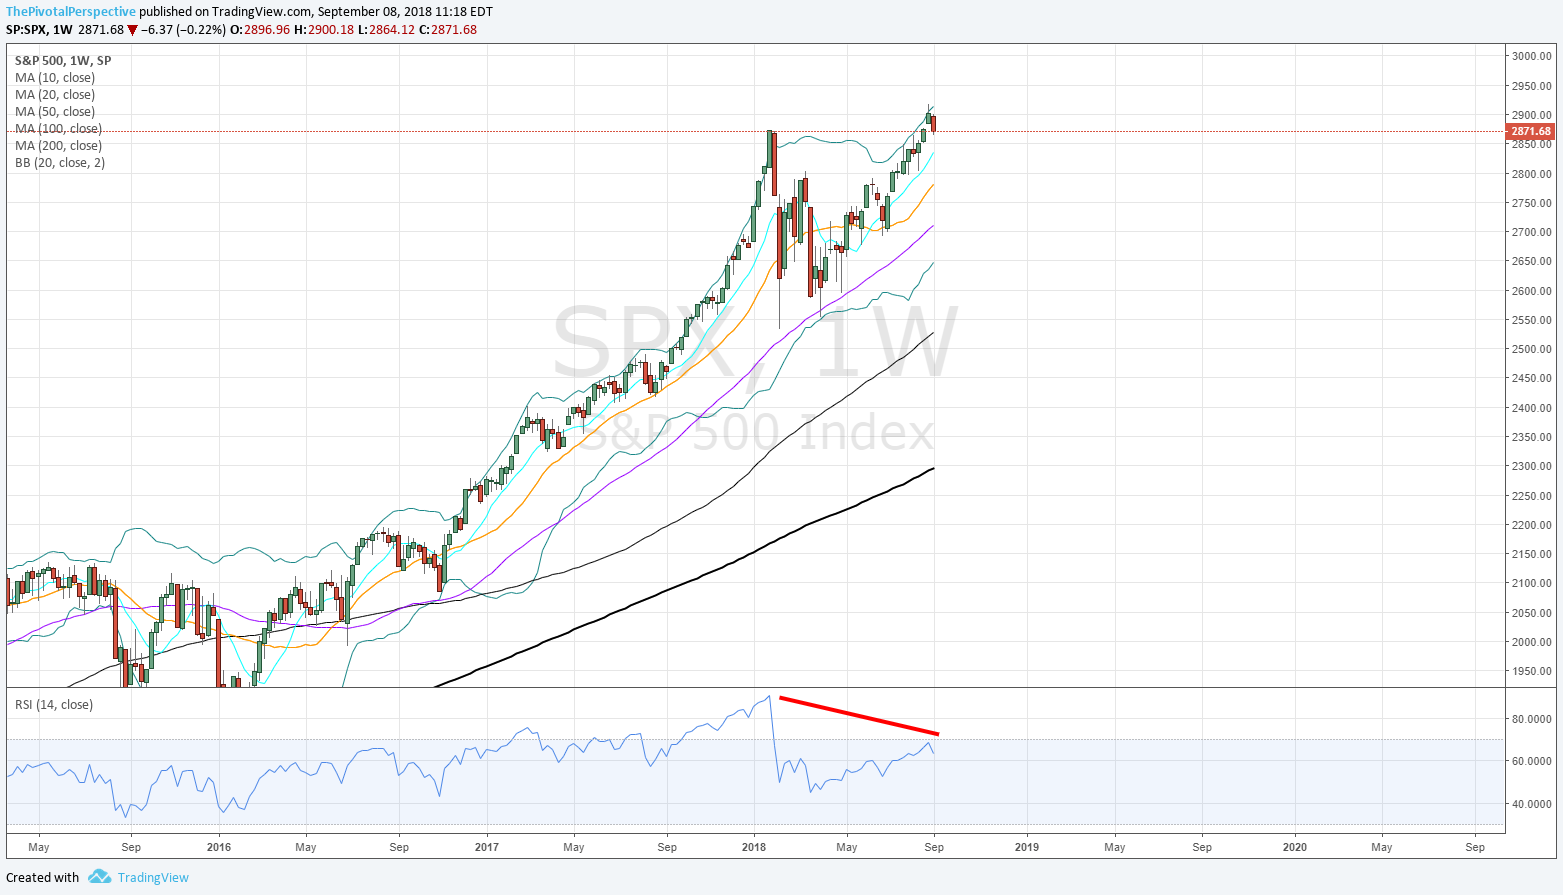
SPX W: BB tags after January have been short term tops.
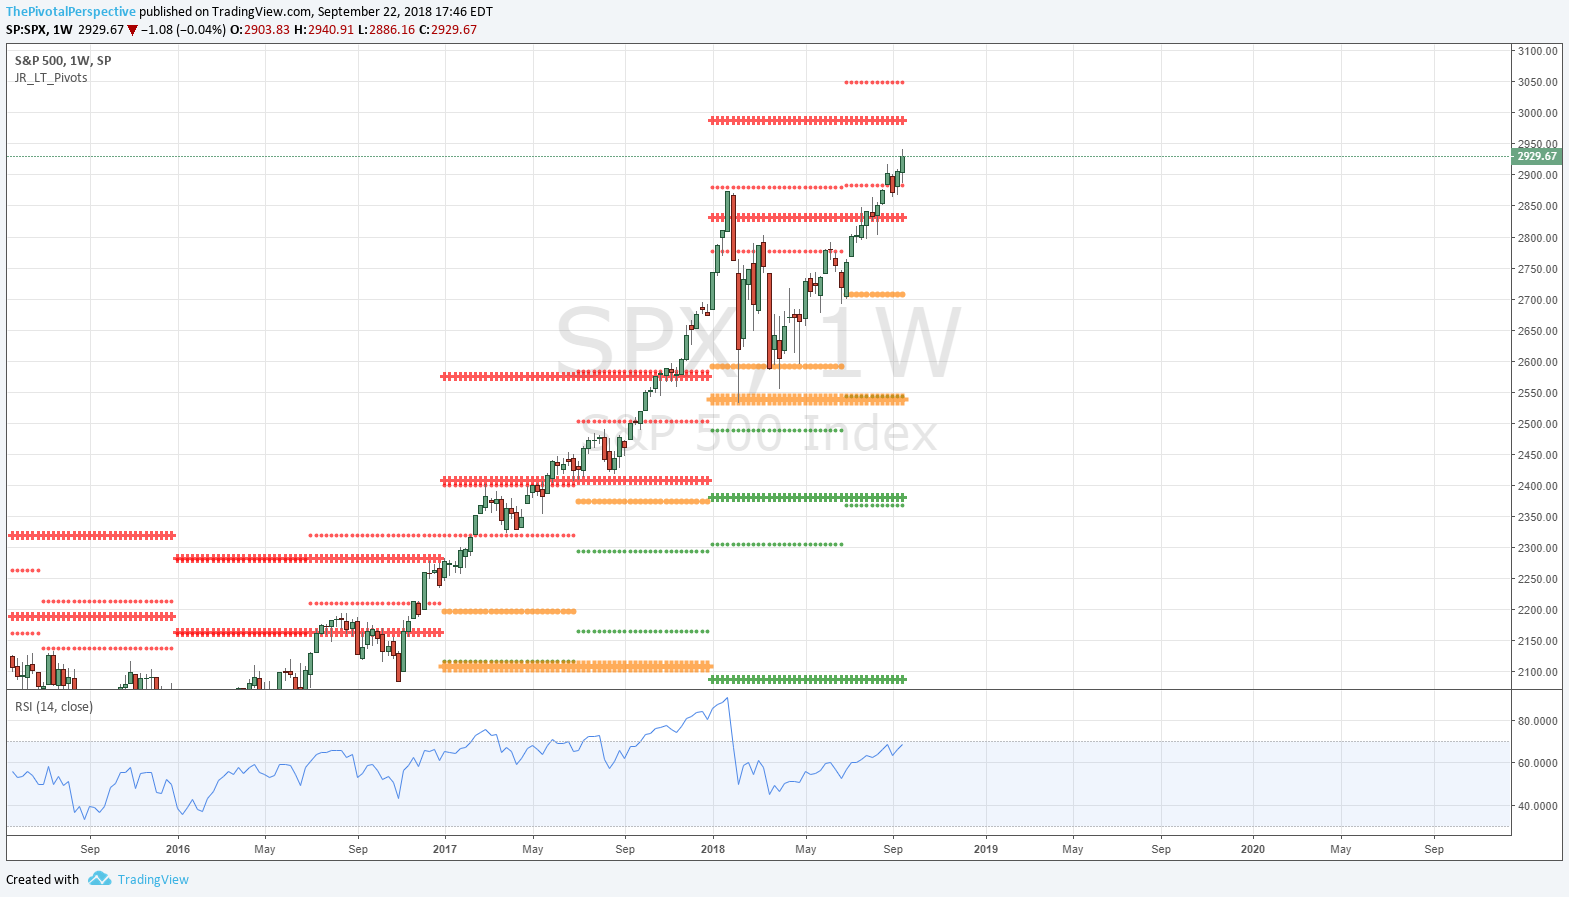
SPX W: This view looks better - above HR1 2883 points to YR2 2987.
SPY D: More bearish looking due to ex-dividend but still, QR rejection.
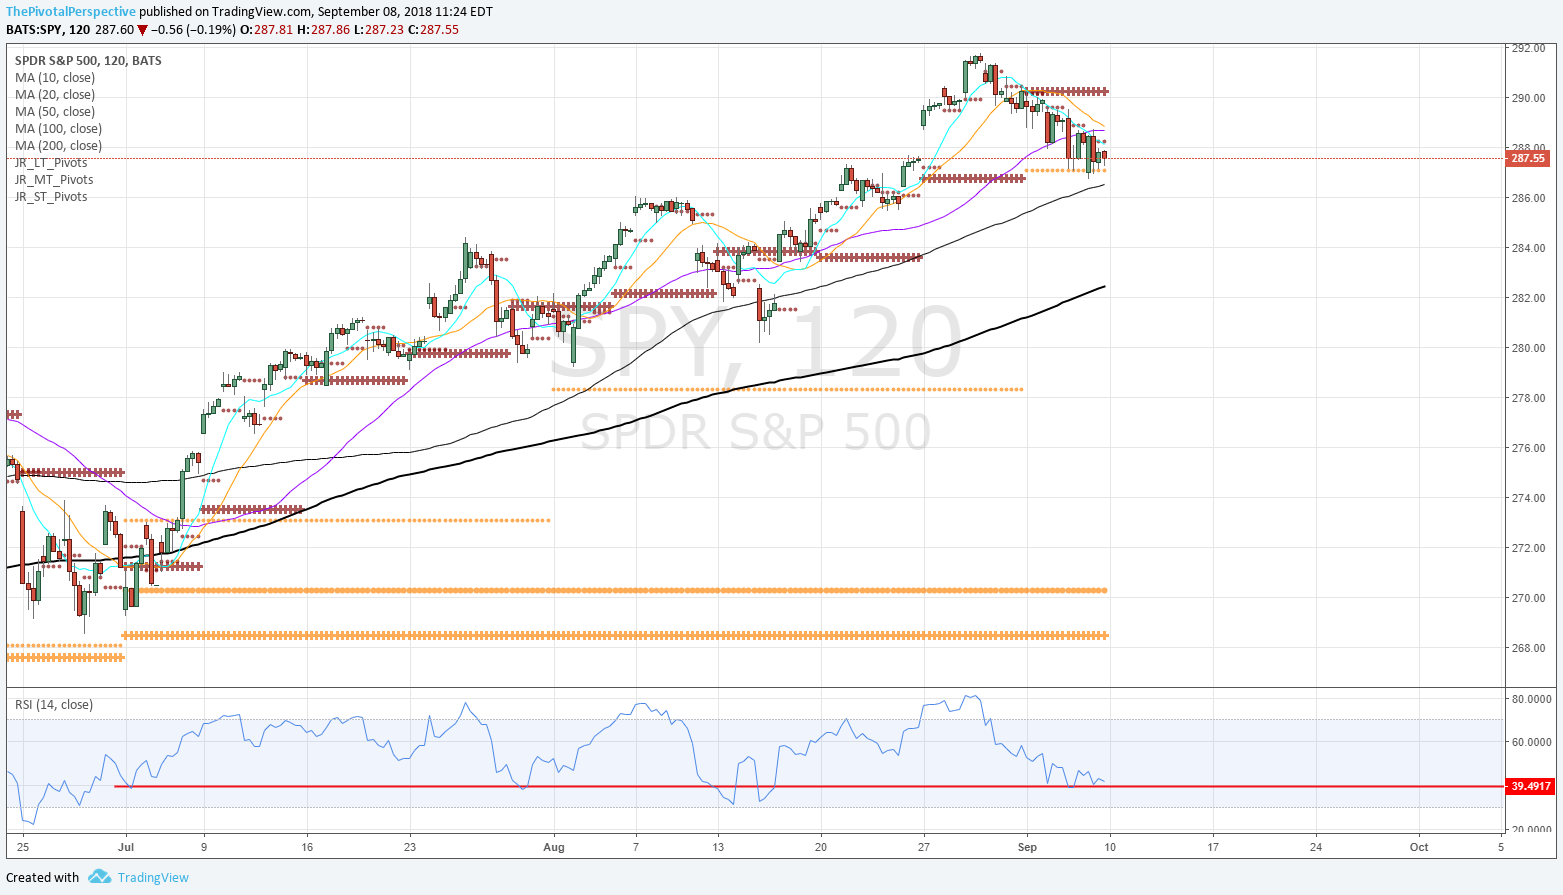
SPY 2H: MP hold earlier in the month was definitive as planned. But RSI reaching 70+ suggests more downside.
SPX sum: Bigger picture above HR1 2883 points to YR2 2987. Short term picture with SPY QR1 rejection and SPY 2H charts recently overbought points to more weakness.
NDX QQQ
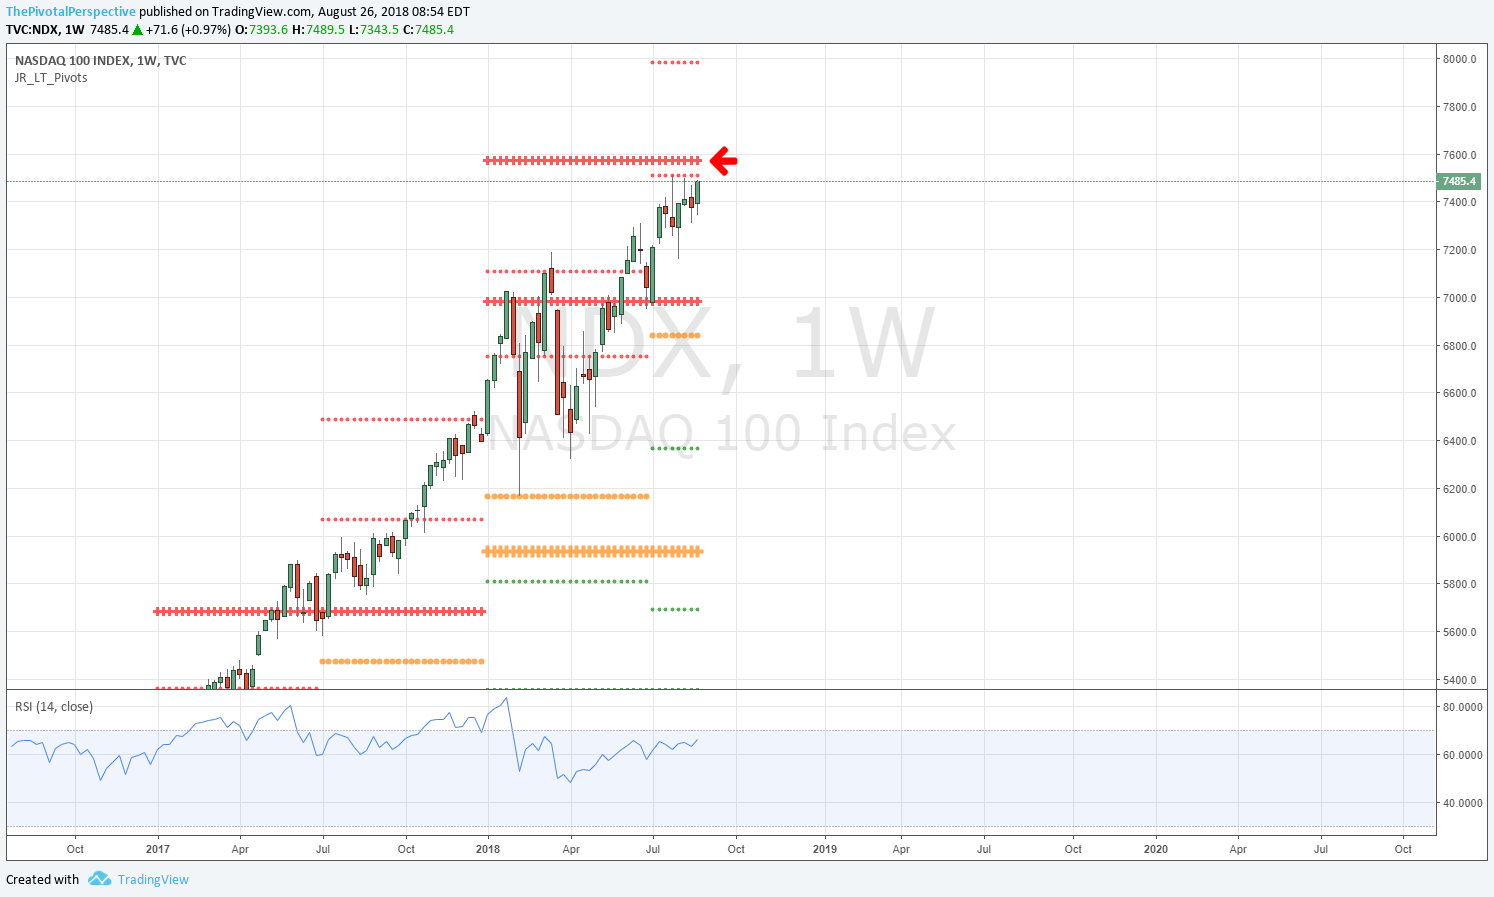
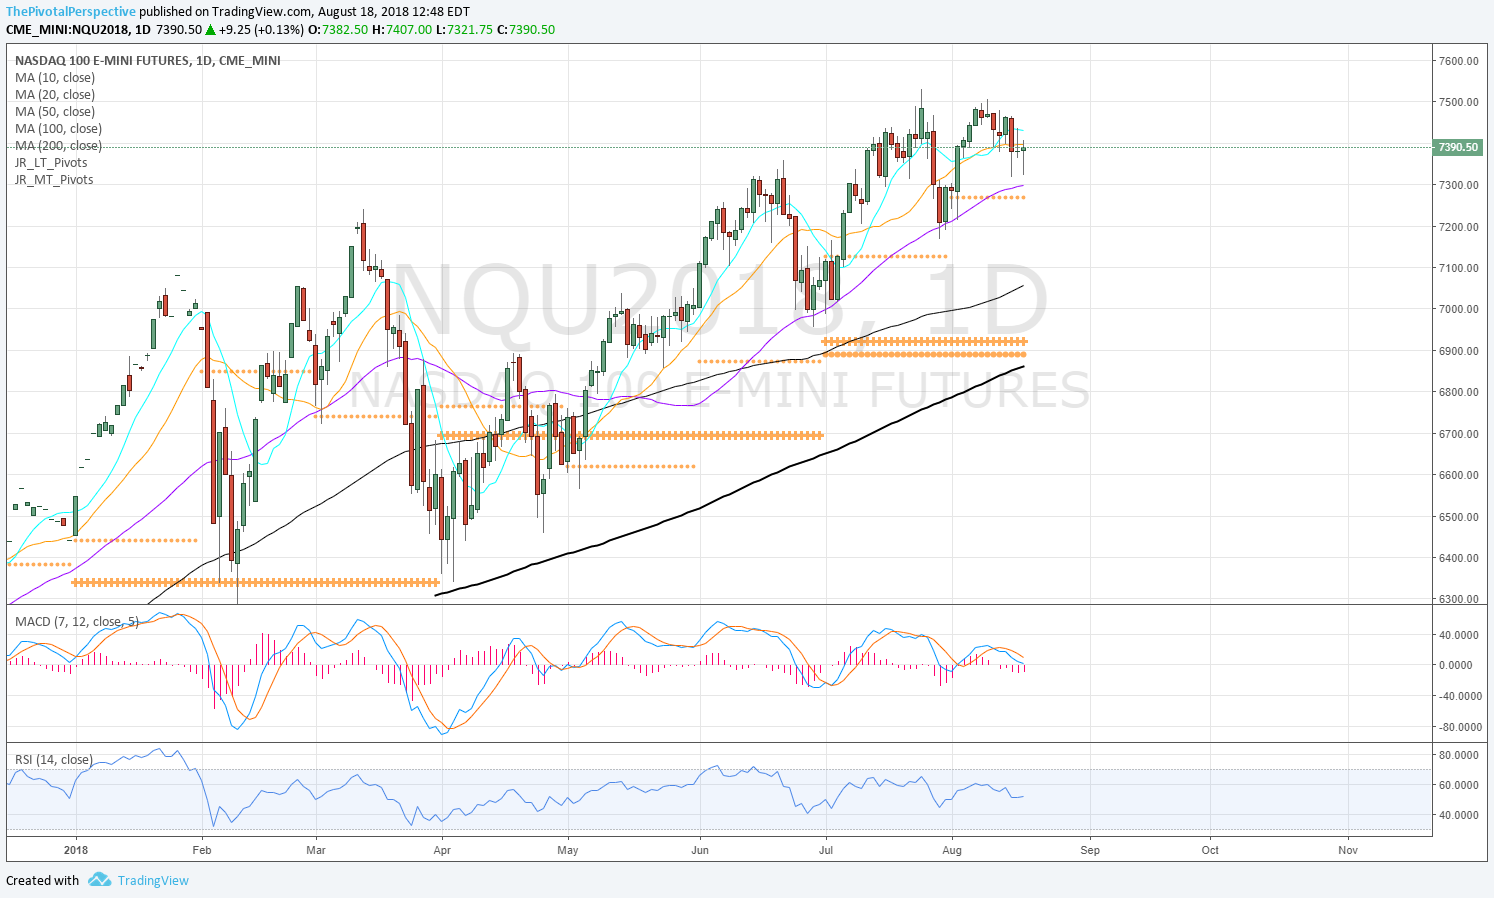
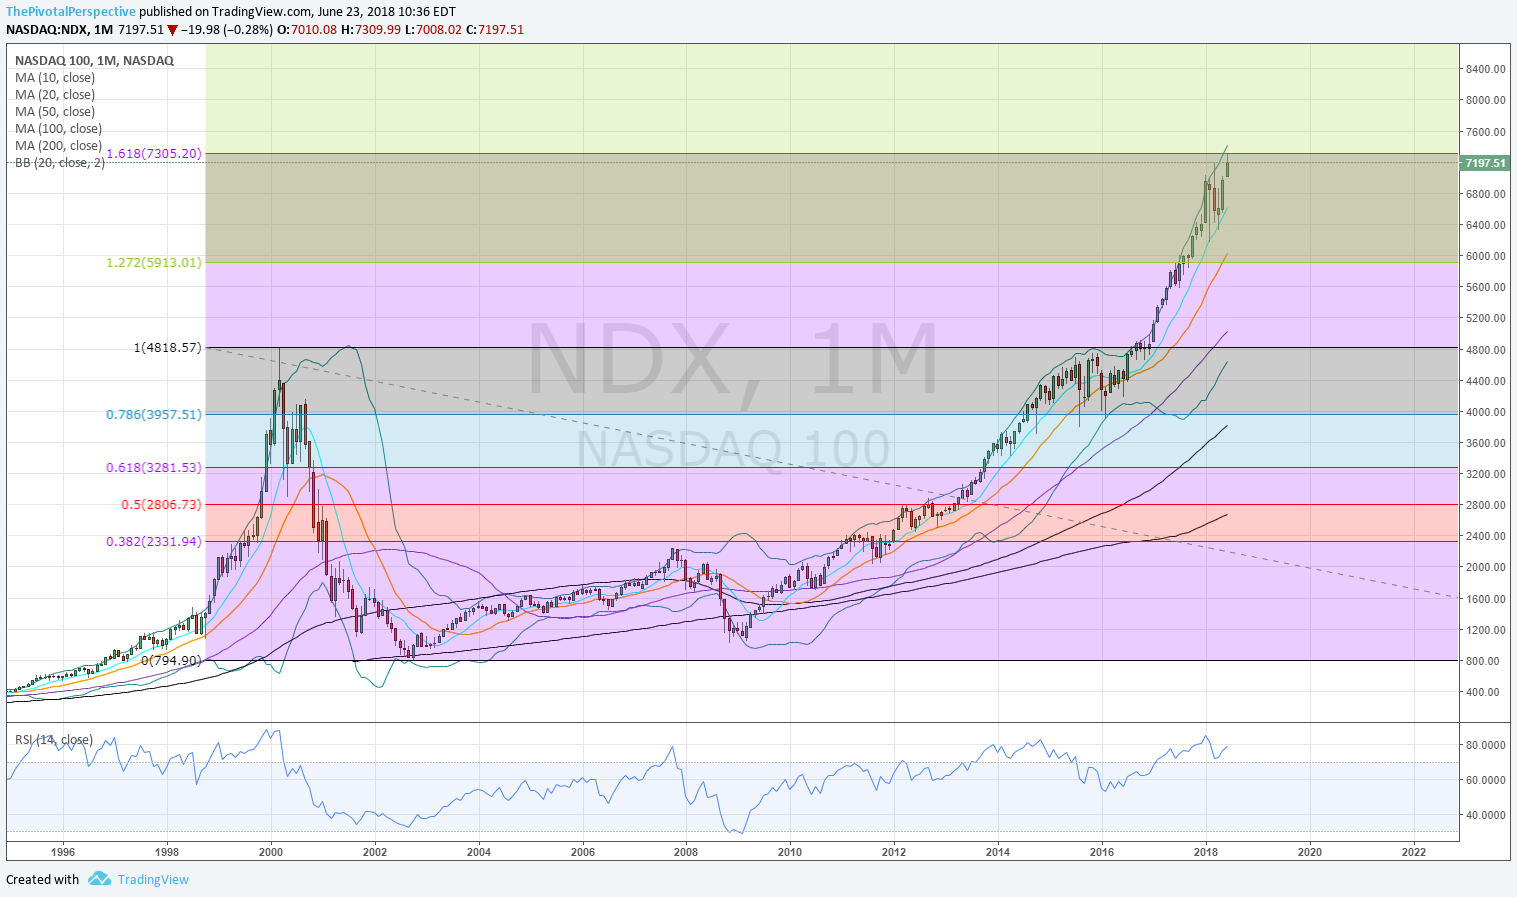
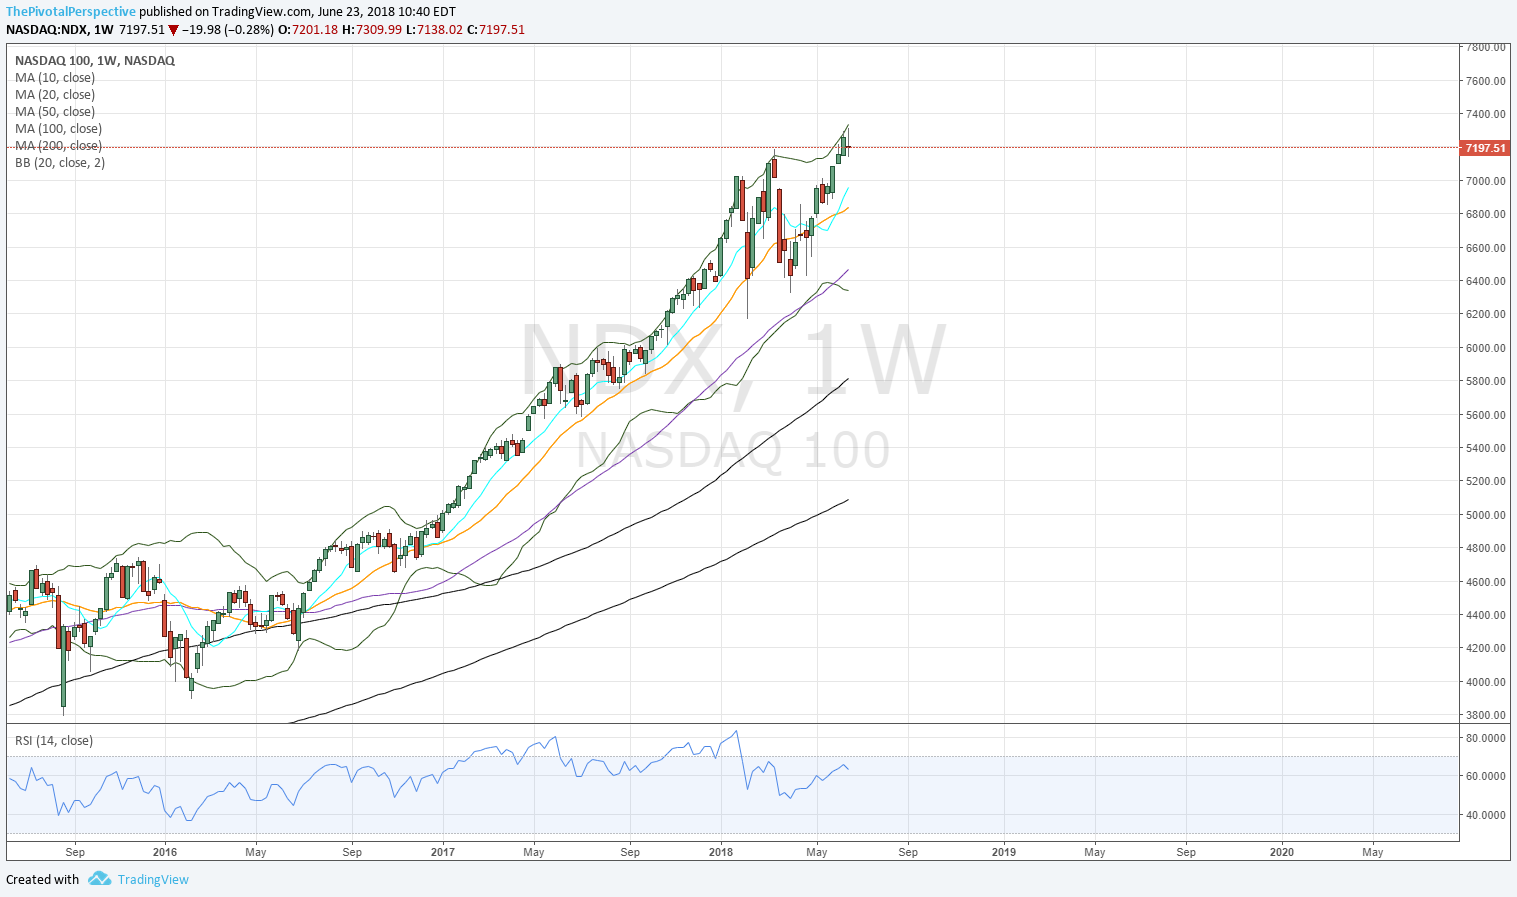
NDX W: Vulnerable to selling with weak advance under YR2.
QQQ D: 2 recent attempts to clear YR2 (9/13-14, 9/20-21) and trouble each time.
NDX sum: Still above all pivots on NDX and QQQ (not on NQ). However, trouble at Yr2 for the 3rd time in Sept. MP decides the next move.
DJI DIA
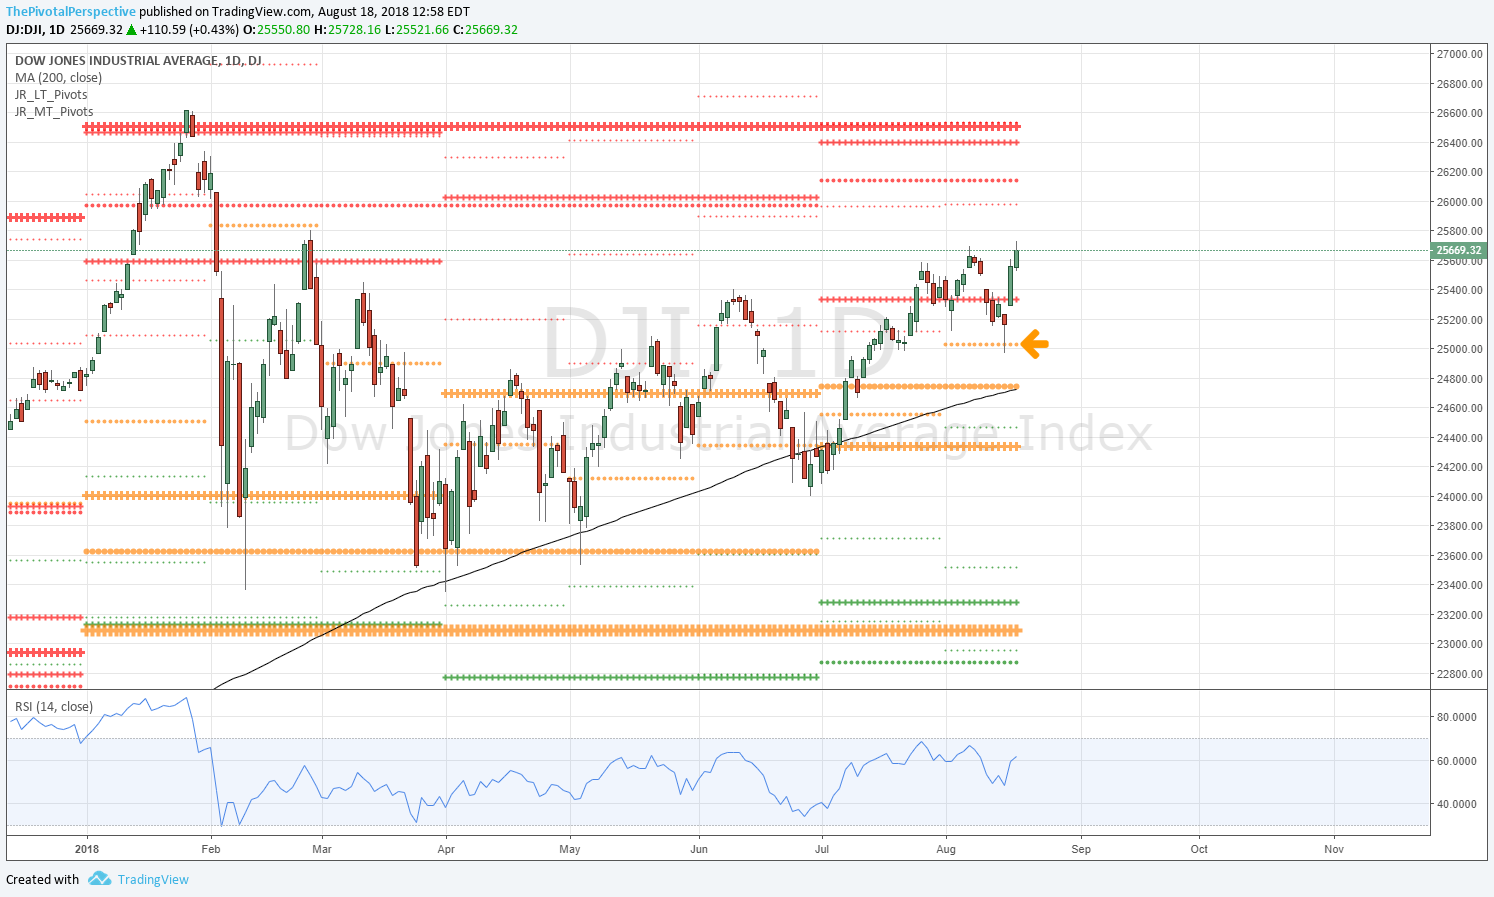
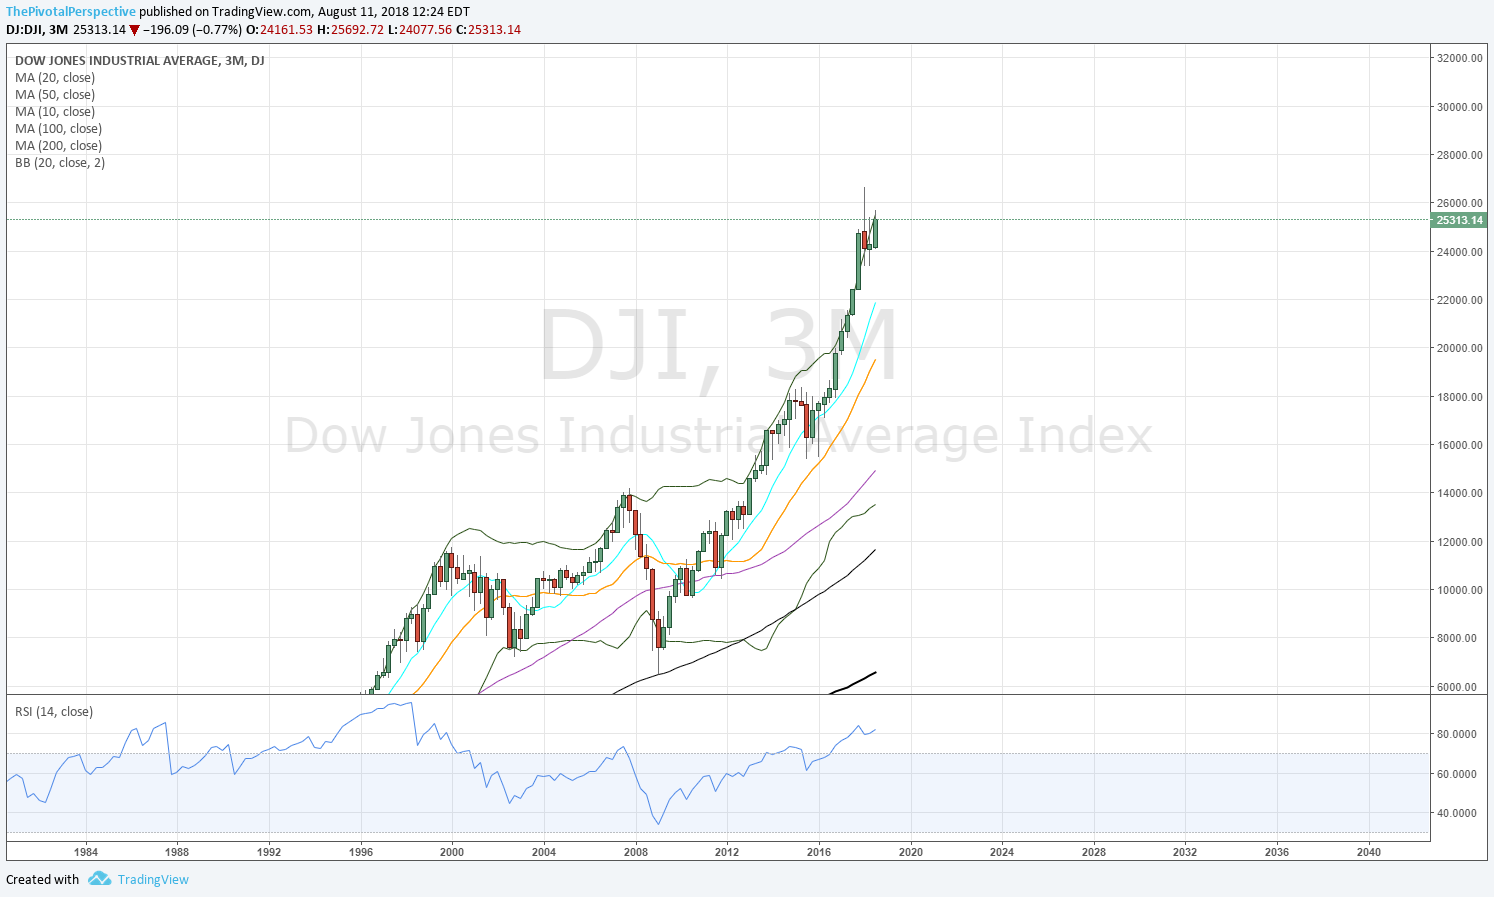
DJI W: Very bullish, launch above HR1 that cleared YR1.
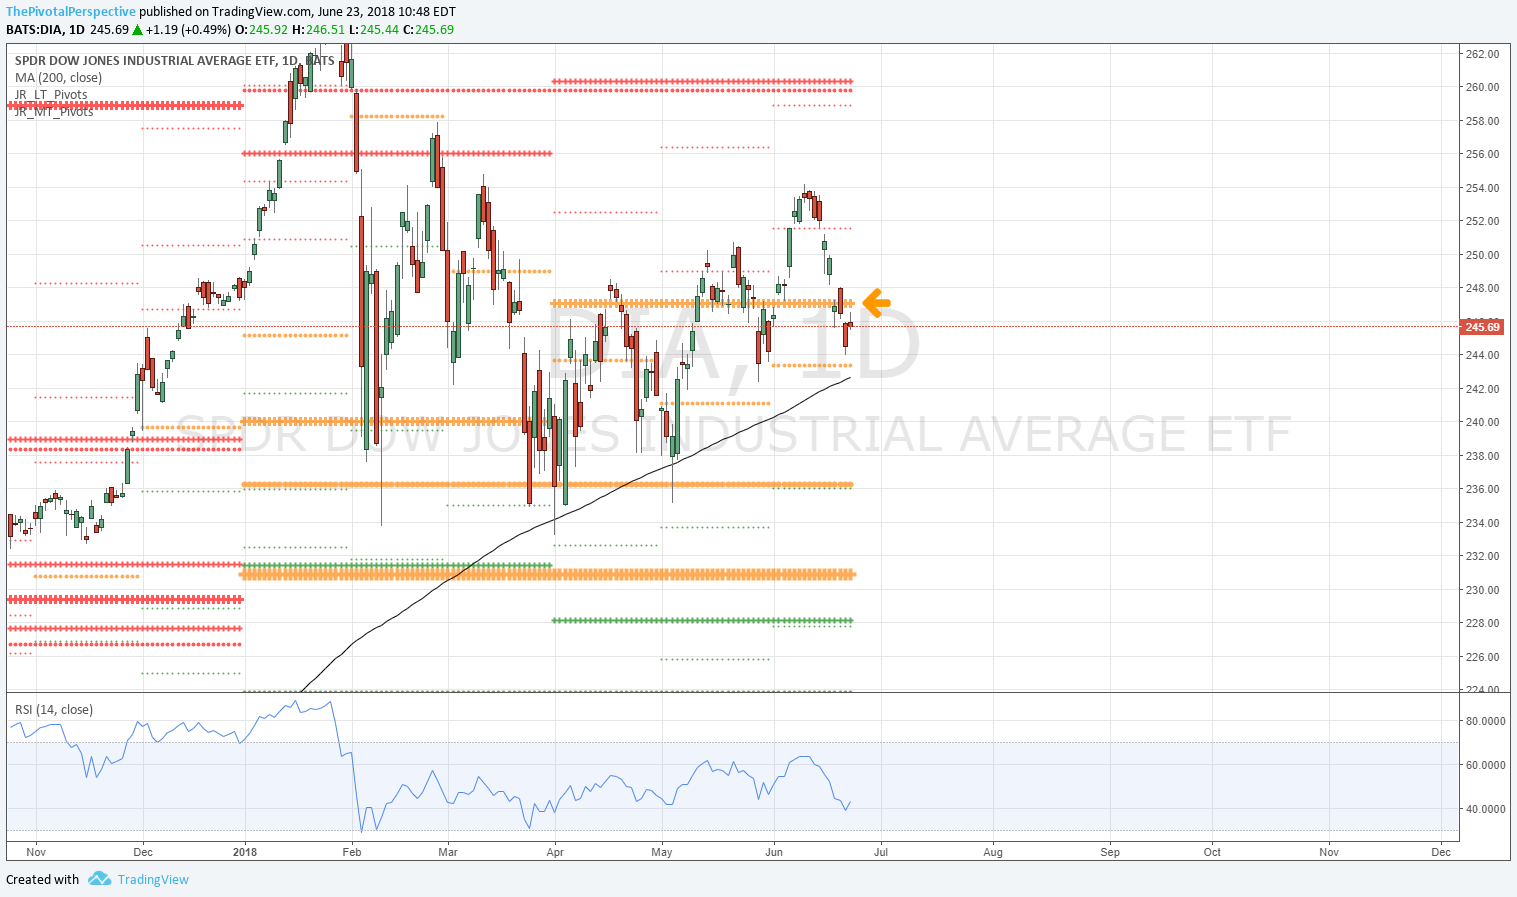
DIA D: Soared above YR1 resistance despite RSI overbought.
DJI sum: Could have topped on YR1 but didn’t; instead, bullish clear.
RUT IWM
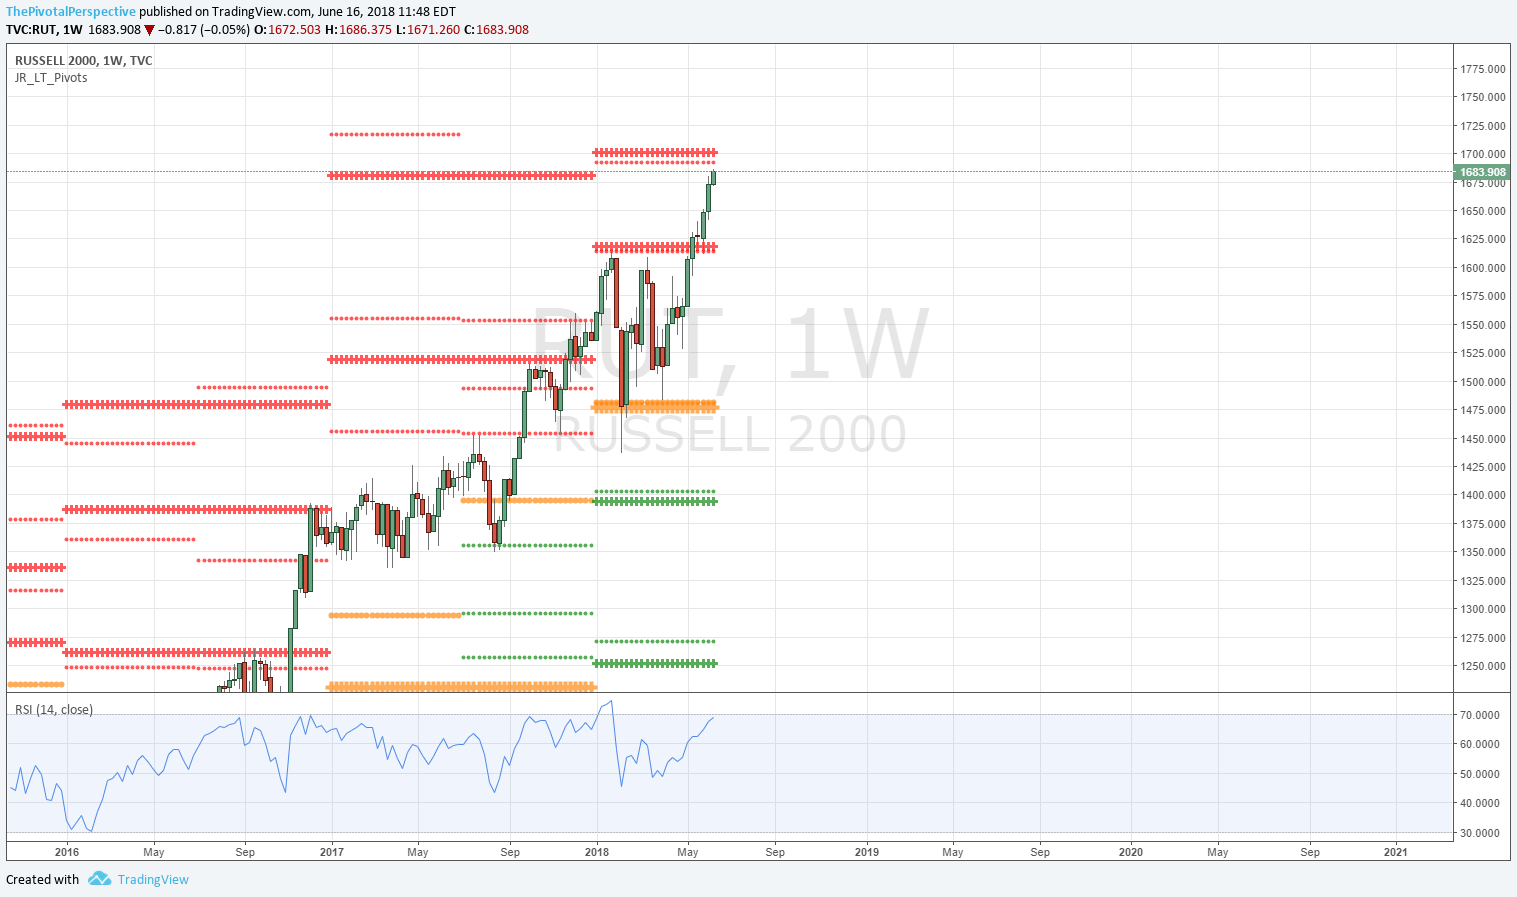
RUT W: Still holding above YR2 as support.
IWM D: 3 days below MP then recovery, again testing level.
RUT sum: If MP / YR2 holds as support, then expect another move up to highs.
NYA
W: Starting to see how definitive the HP test 6 bars ago was.
D: At QR resistance with RSI 69.7 invites pullback.

