Sum
Some bearish developments this week: NDX and NYA both under MPs. This is a bit more threatening with NDX YR2 HR1 rejection and other areas testing - SPX testing HR1, RUT YR2 and DJI HR1.
Typically pullbacks to pivot and rising MA support are bought more often than they break. So it is possible that buyers are back with the non holiday week and all will be well. But if that doesn't happen, and SPX and RUT both break there monthly pivots with long term levels looking more like rejection, then a deeper pullback could be in the works.
Bottom line - pulling for bounce but ready to be more defensive if more USA mains are under MPs.
SPX SPY ES
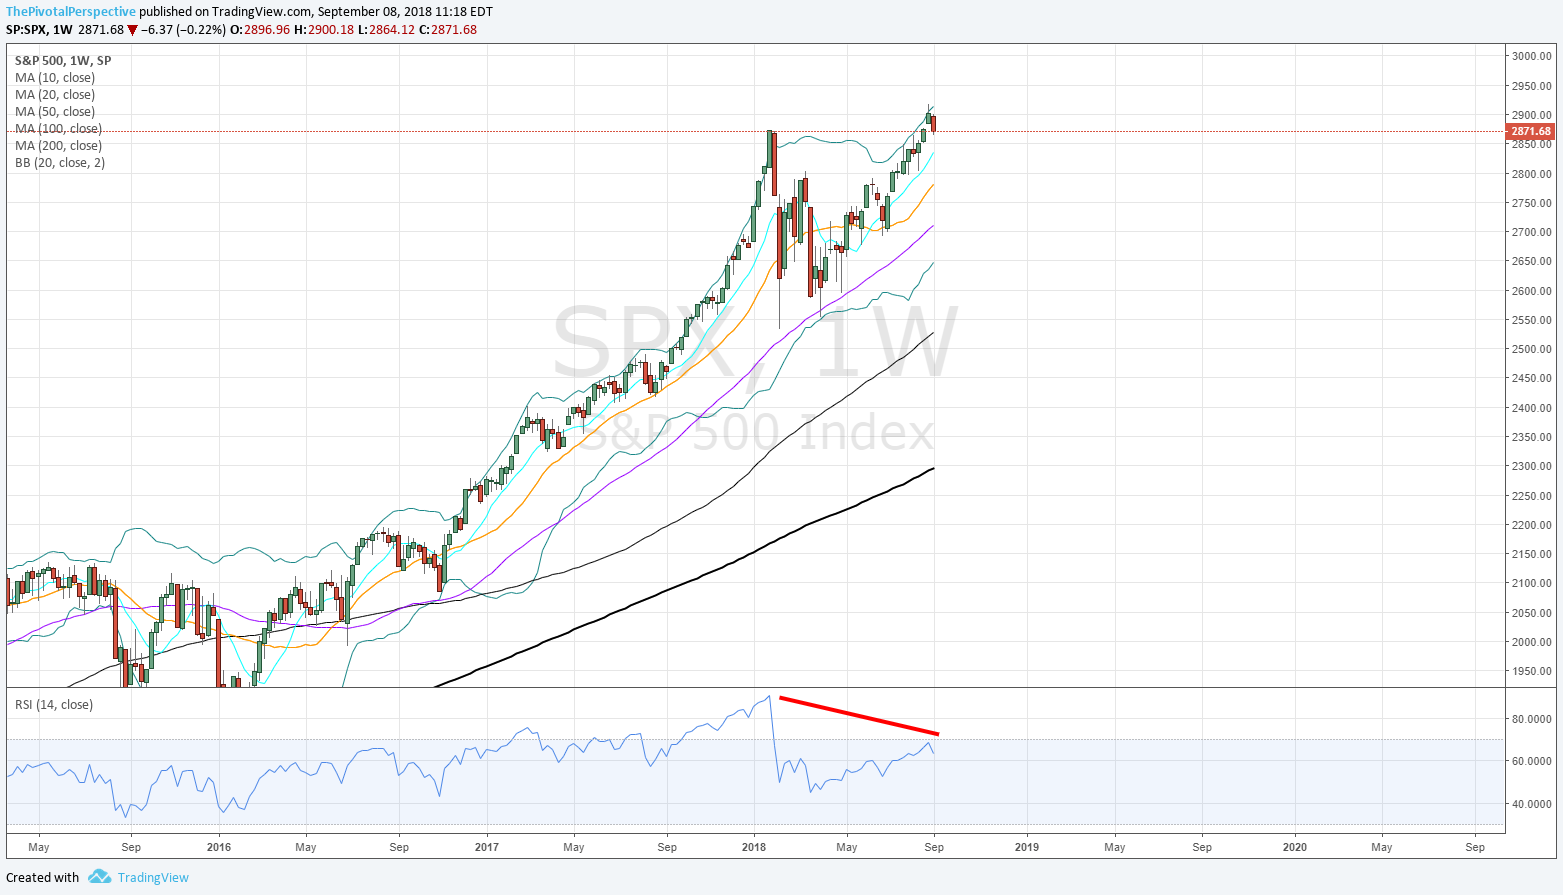
SPX W: From this view a normal reaction from upper BB and RSI near 70.
SPX W: From this view more threatening if HR1 starts acting as resistance.
SPY D: SPY hanging on to MP.
ES D: In this chart I have drawn up arrows where the ES has held various pivots this year, and down arrows where they have broken. Not guaranteed, but odds favor bounce.
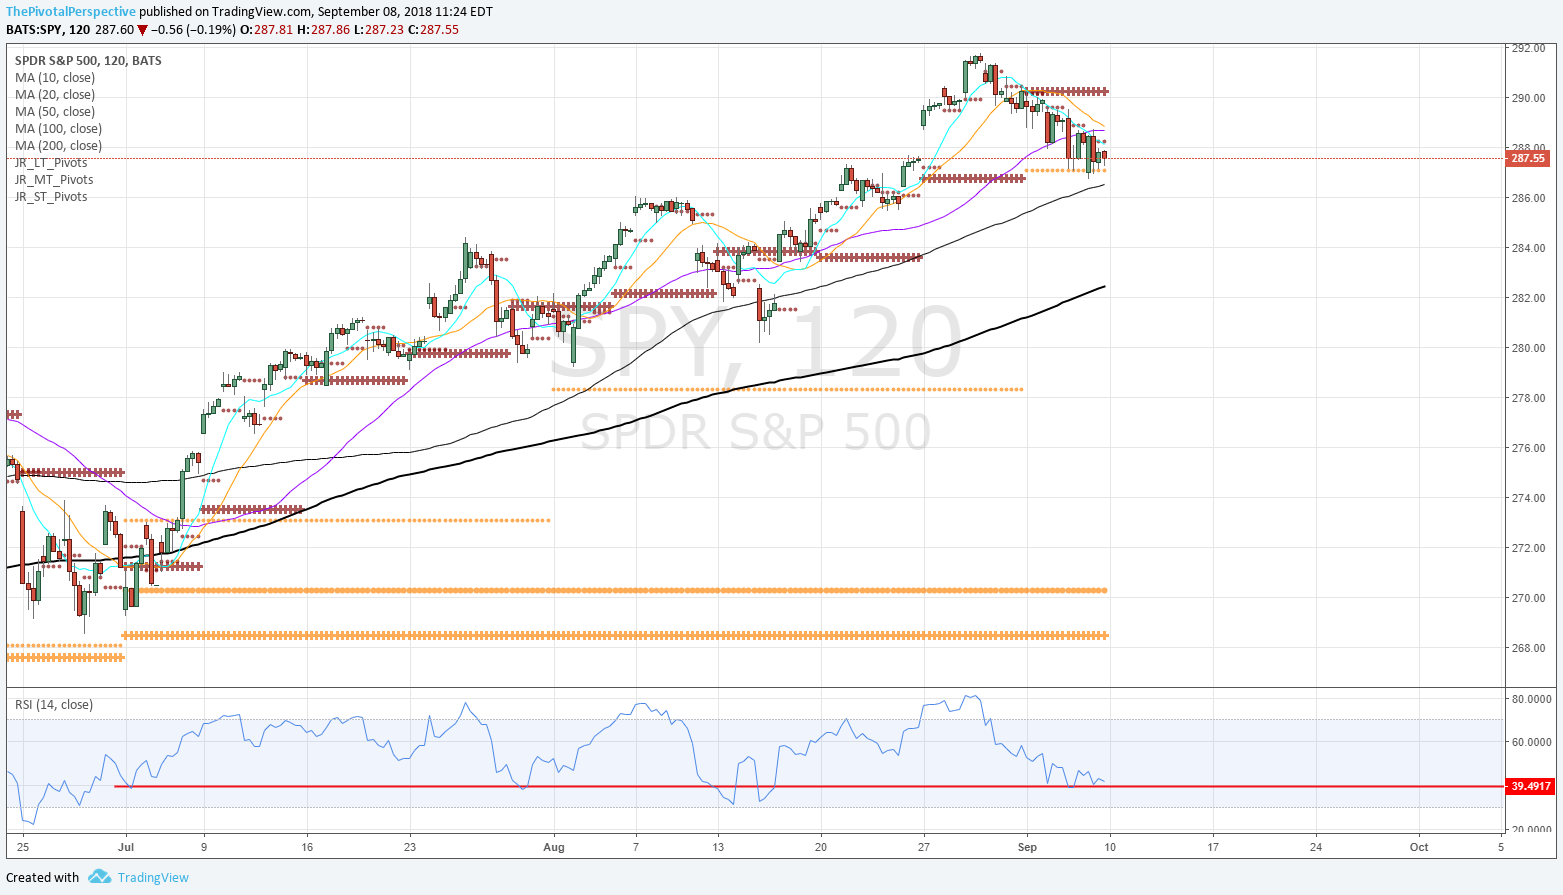
SPY 2H: RSI not yet 30 but nearing areas where buyers have stepped in. First test of MP on this vehicle since early July (ES tagged its MP early August per the other chart).
SPX sum: Short term weakness in a larger uptrend is usually bought. There is a monthly pivot and rising 20MA that both can act as support; usually good setup for bounce. If a bounce does not happen then that may turn into a more important development as HR1 is in play as resistance.
NDX QQQ
NDX Q: Reminder that the quarterly chart RSI is above 90. The last quarter that was down in a threatening manner was 2015 Q3, 3 years ago.
NDX W: Uh oh. YR2 and HR1 rejection.
QQQ D: Red arrow at YR2, orange at MP. Bearish configuration. Next support not far at SepS1.
NDX sum: Something to carefully watch here as YR2 HR1 rejection in process along with break and rejection of MP.
DJI DIA
DJI W: 2 bars pausing under HR1 but no selling yet.
DIA D: High bang on HR1, but not much drop and well above MP.
DJI sum: At resistance area, but so far no selling and still above MP. If that clears then YR1 also above.
RUT IWM
RUT W: Still above YR2.
IWM D: High on QR1, then pullback to test YR2 and MP area.
RUT sum: Holding up better than NDX QQQ on this drop.
NYA
W: Not near any long term level.
D: Above QR which could act as support, but below MP which is acting as resistance.


