Sum
2018 leaders NDX and RUT approached key resistance clusters and fell back. NDX had near tag of HR1, which is part of a larger YR2 HR1 QR1 cluster; and RUT has been stuck under YR2 since June.
SPX had cleared its YR1 for the 2nd time in early August, and so far the pullback found support at this level.
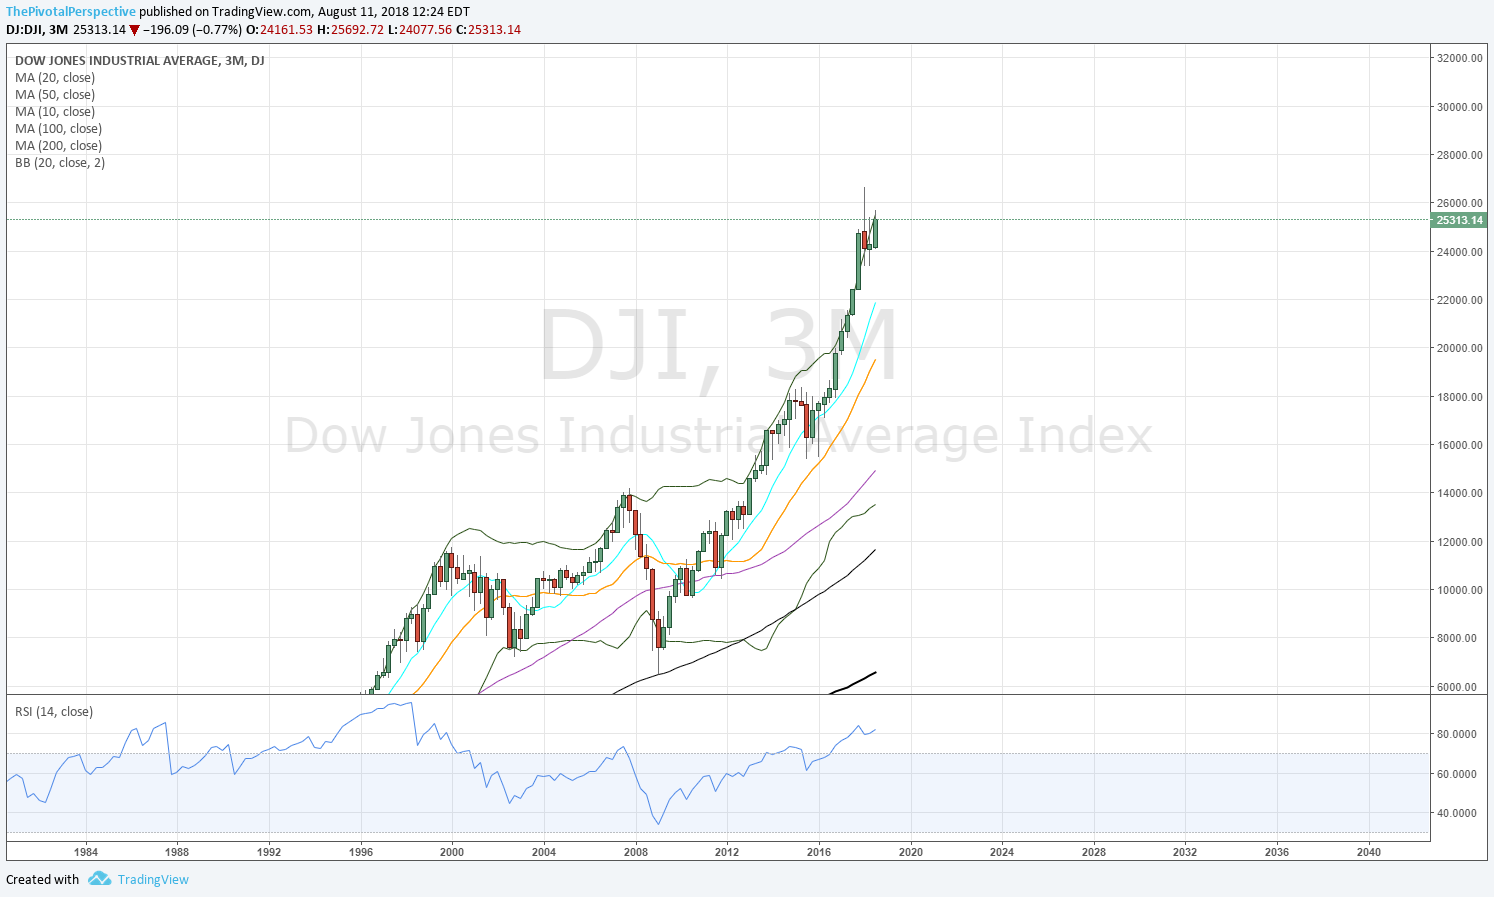
Laggards DJI and NYA are weaker across the board, with more trouble at quarterly and weekly Bollinger bands.
Bottom line - to me SPX looks like normal pullback to support, so I'm expecting a bounce as the next move. If so then leaders NDX and RUT may try again at their resistance clusters. At this point I think RUT has a greater chance of clearing its YR2 than NDX. If weakness continues into next week then DJI will likely be the hedging short index vehicle of choice.
SPX SPY ES
SPX W: 2nd week above YR1 at 2830, and as long as that maintains HR1 test remains the target.
SPY D: A few too many trading tops not on pivot resistance this year since April - a bit annoying.
ES D: Just a normal pullback to rising 10 and 20MAs, with the YR1 level also holding as support. This has been on a clear buy since 7/6 above all pivots and MAs.
SPY 2H: From RSI OB down to weekly support. Looks normal and next move typically bounce.
SPX sum: While I do wonder how long SPX will power up outside the quarterly Bollinger, so far trend gets benefit of the doubt with a normal pullback to support on pivots (YR1), moving averages (10 & 20 daily MAs), and short term support on the weekly pivot (different next week but still, so far near the low).
NDX QQQ
NDX W: Looks more toppy with near test of HR1 and sharp drop from that high. Also note: NDX quarterly chart (not shown) RSI 90+ and has closed outside its BB 4 quarters in a row, now working on #5.
QQQ D: Doesn't look too bad, just some shuffle off highs. I do think this QR1 HR1 YR2 area will not breakout so easily though. Note the action in the first half from these levels.
ND Q: Still above all pivots and MAs. If lower then D50 along with AugP is support.
NDX sum: Everyone knows NDX has been the leader of the bull market. Even just tracking NDX over SPX has generated substantial outperformance for most of the decade. But quartelry RSI is 90+ and when these things end it may not be gradual. Currently the index has tested a resistance cluster of YR2 HR1 QR1 twice and so far not getting through. I don't think the index will be powering up through these levels in August so easily.
DJI DIA
DJI Q: Pushing the band but last quarter and this one so far more difficulty to trade above (as SPX and especially NDX are doing without any issues).
DJI M: Down for the month so far.
DJI W: Trouble at the weekly BB 2 of the last 3 weeks.
DJI W: Above 2HP, but not near any long term resistance.
DIA D: Shuffle at QR1 with 3 tries above and 3 breaks.
DJI sum: Having trouble at quarterly and weekly BBs and lagging SPX and NDX. Given DXY and international issues, this is likely to continue.
RUT IWM
RUT W: Stuck under YR2 since 6/11 bar. One could also say 2 decent selling attempts and itis back to the level for the 5th or so time. With DXY strength this is poised to resume leadership which implies clearing this level.
IWM D: Above Aug P, but this chart shows how clearly YR2 has acted as resistance. The move from 4/2 low to 5/1-3 higher lows then move to YR2 is a thing of beauty to my eyes.
RUT sum: Stuck under YR2 since June, but back near highs. I don't know if it will get above but given macro situation I think more chance of RUT clearing YR2 than NDX as this point.
NYA
NYA W: Looks more like DJI.
NYA W: Above 2HP, but probably will be first to break if weakness continues.
NYA D: Still above AugP though it too back under QR1.


