REVIEW
5/29/2017 Total market view: "I have been skeptical of the recent bounce but put caution on hold when indexes cleared pivots last week and VIX & XIV confirmed. Either the market will push to next levels higher - SPY Q2R1, QQQ Q2R2, DIA YR1 - or fade. We'll see what happens. ... Back to 100% long but at some point (and I believe sooner rather than later) a defensive adjust will pay."
Result
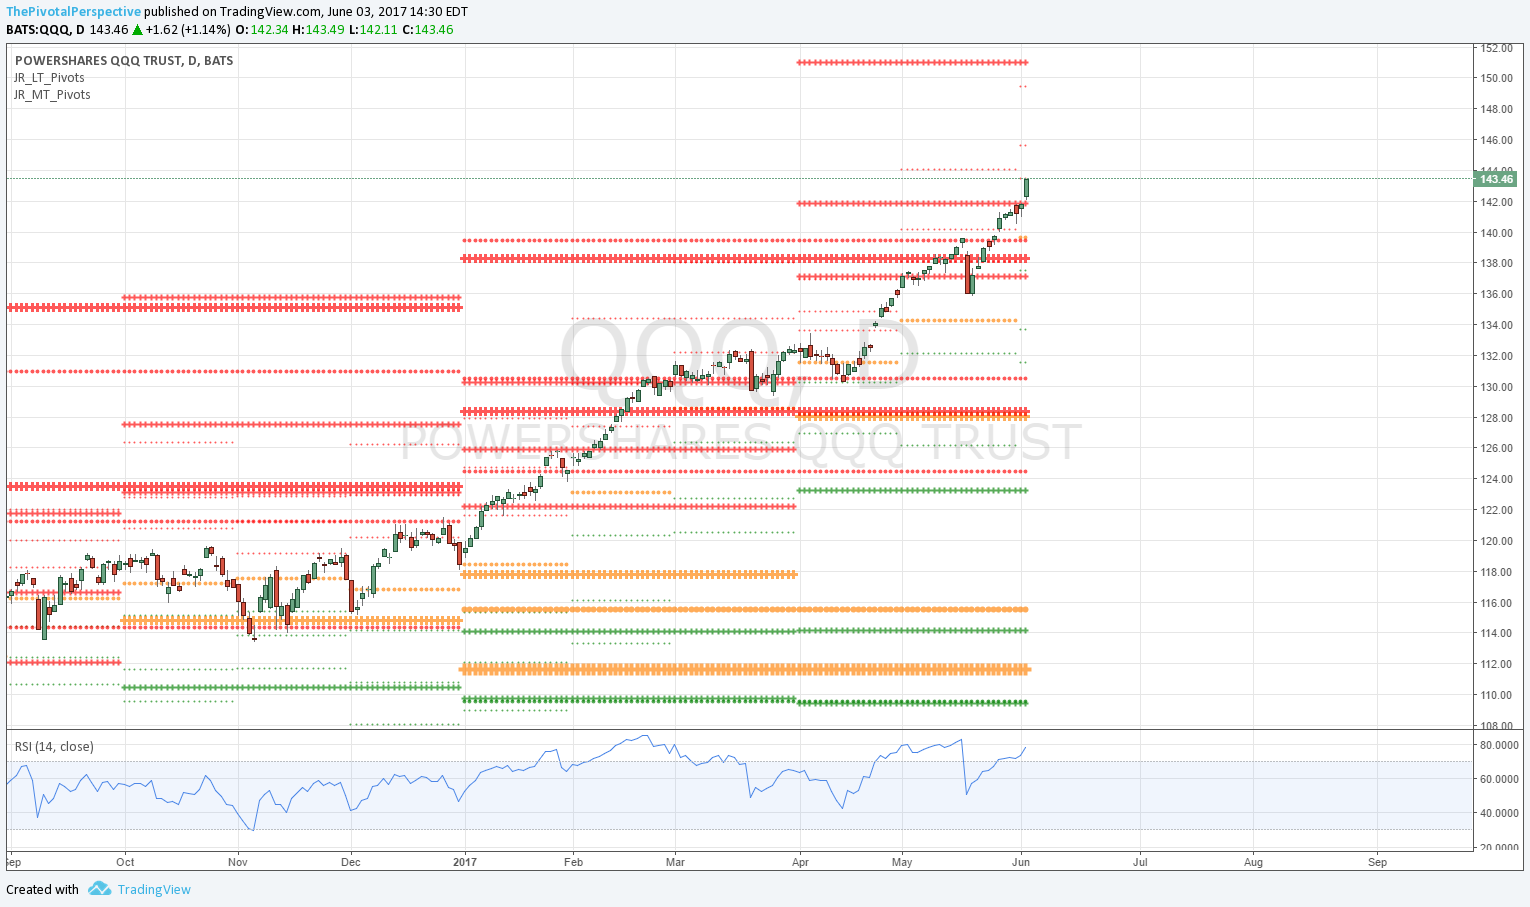
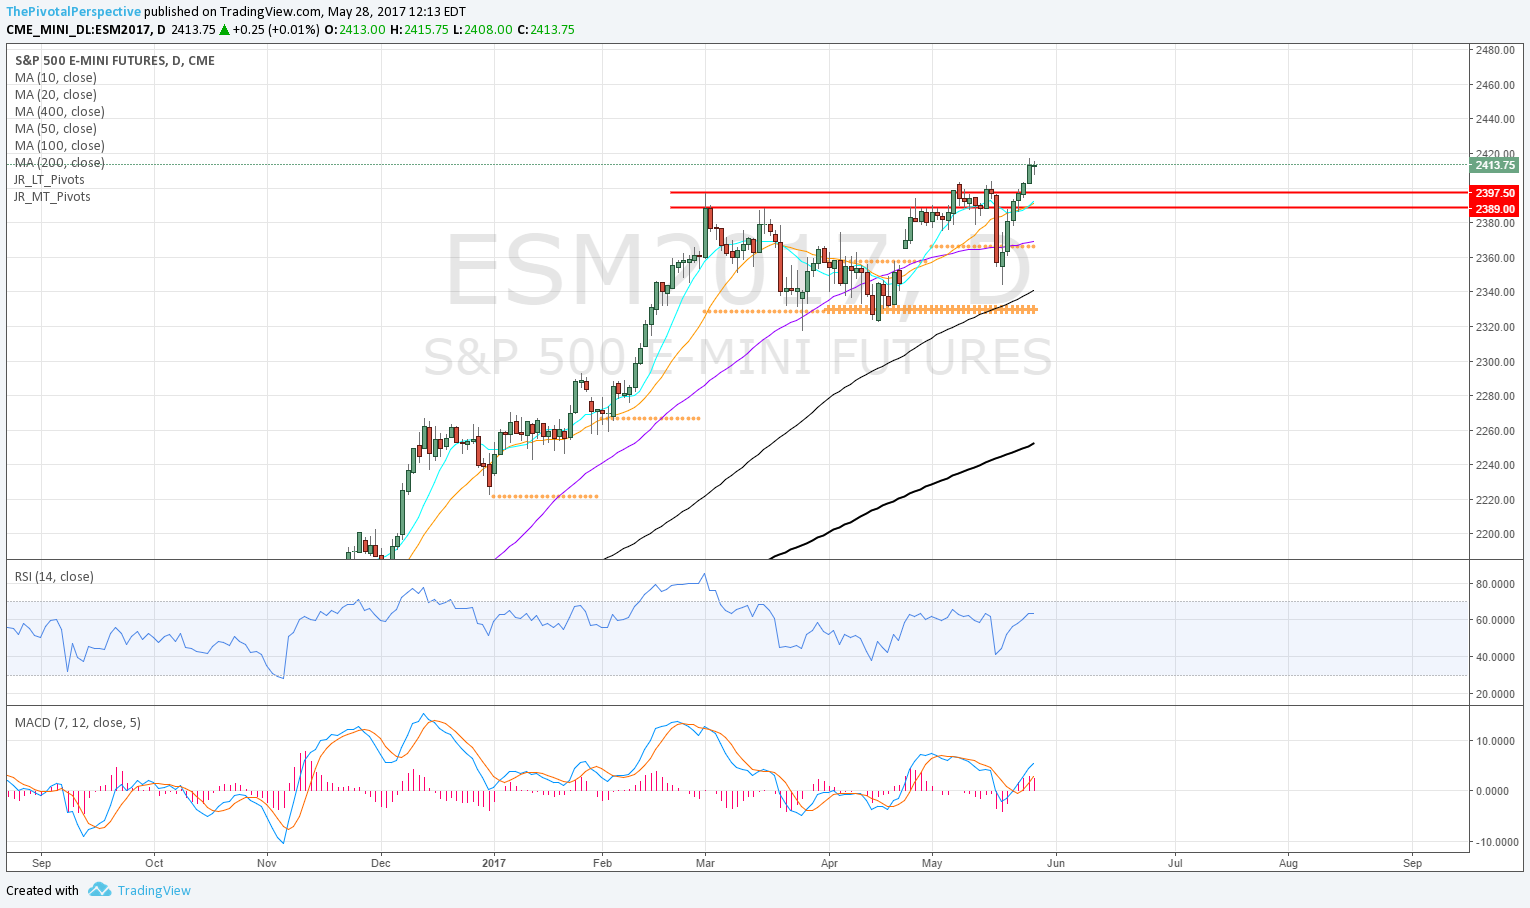
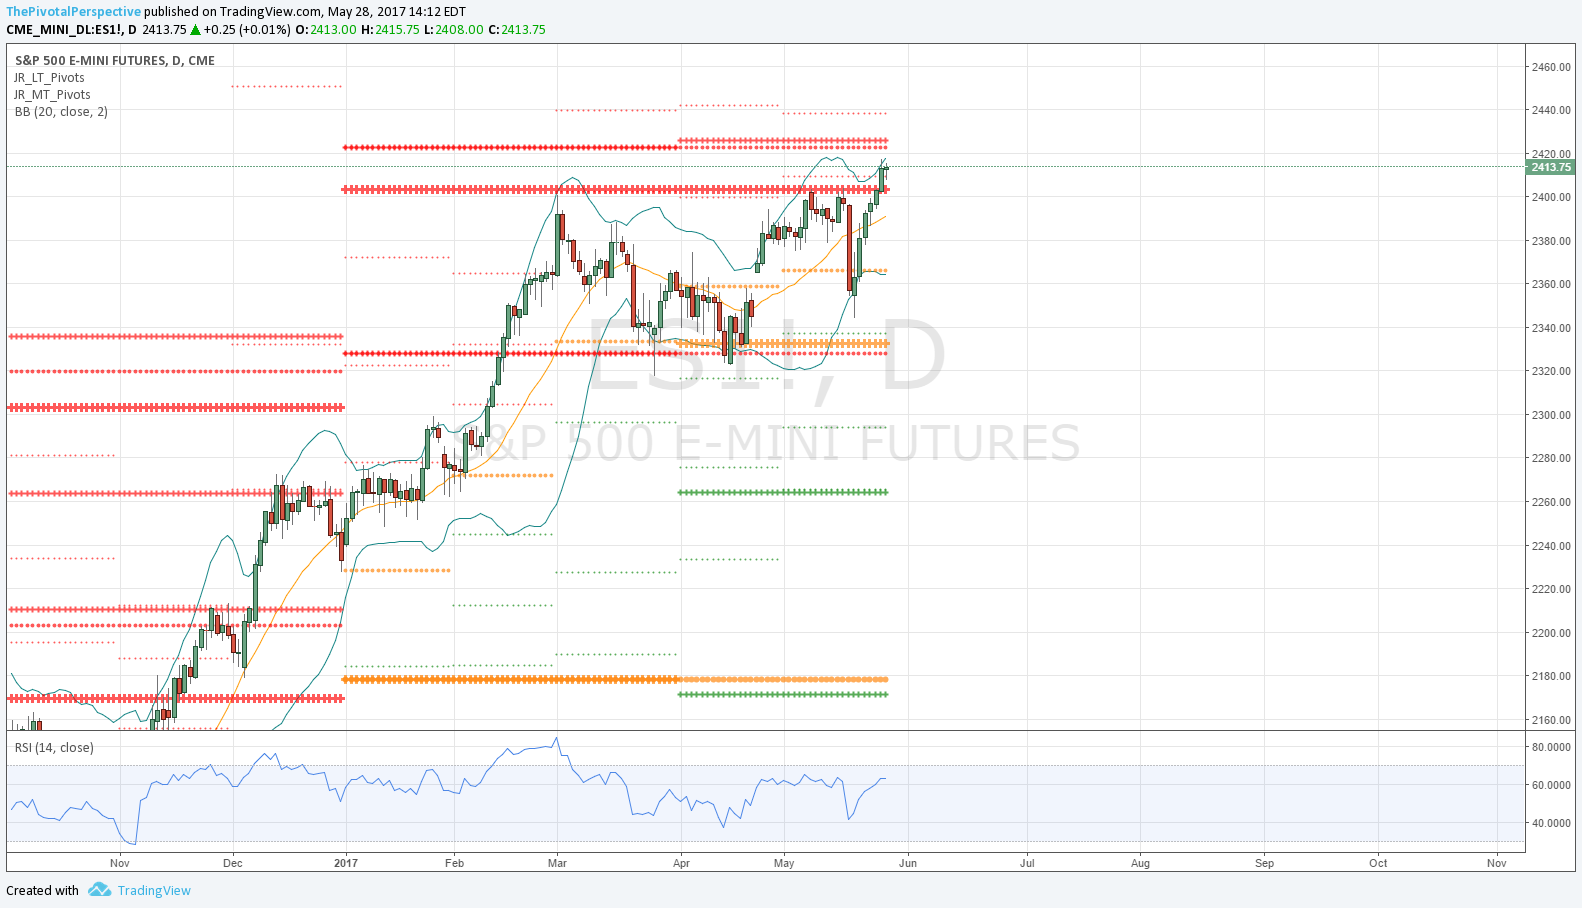
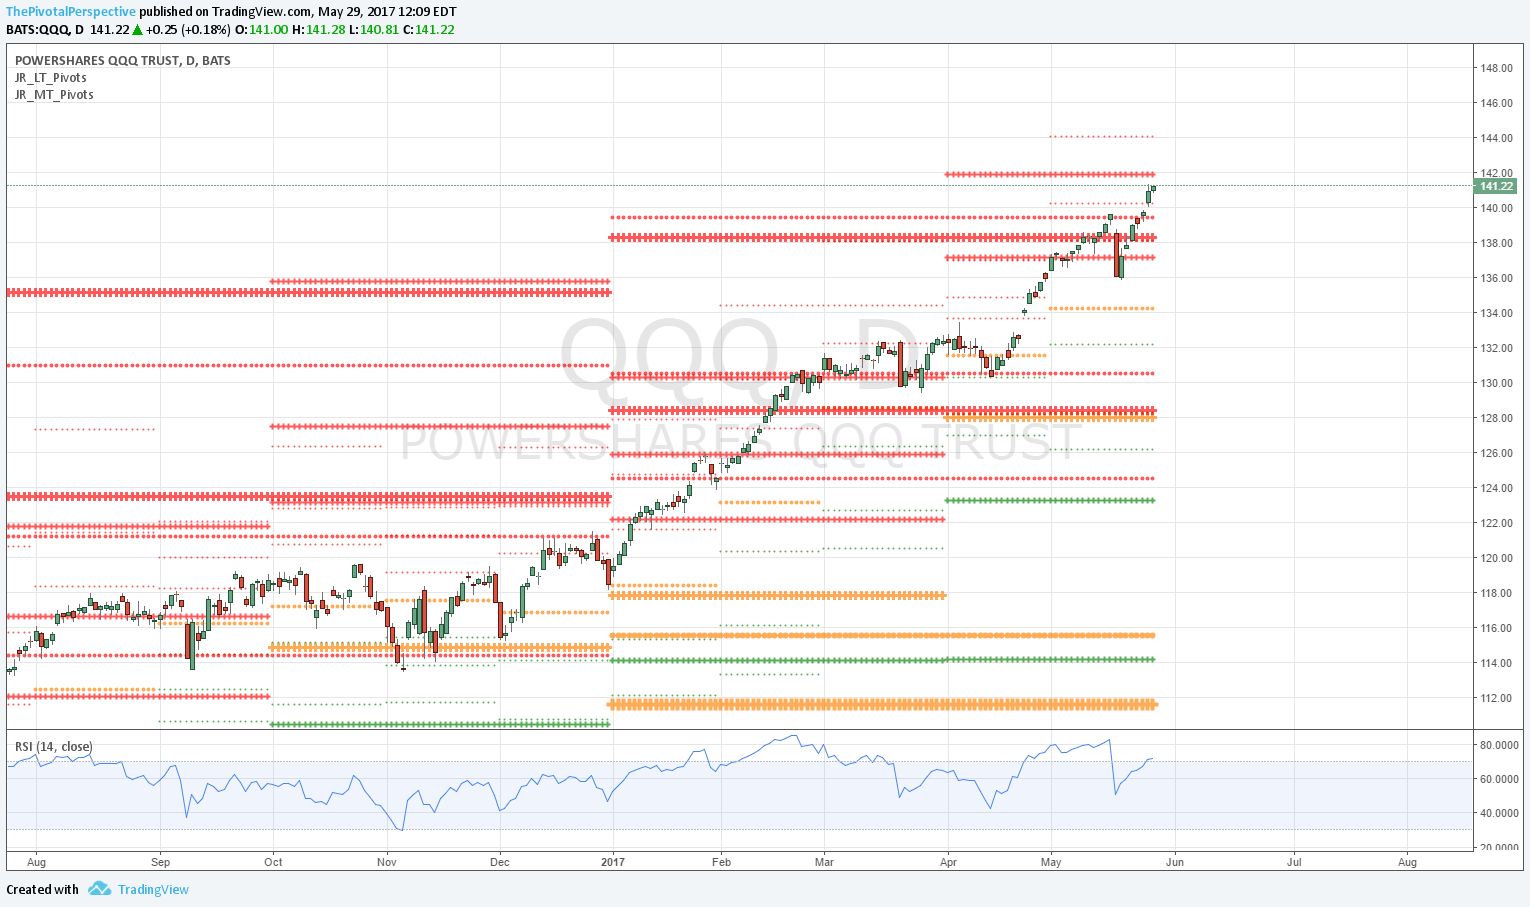
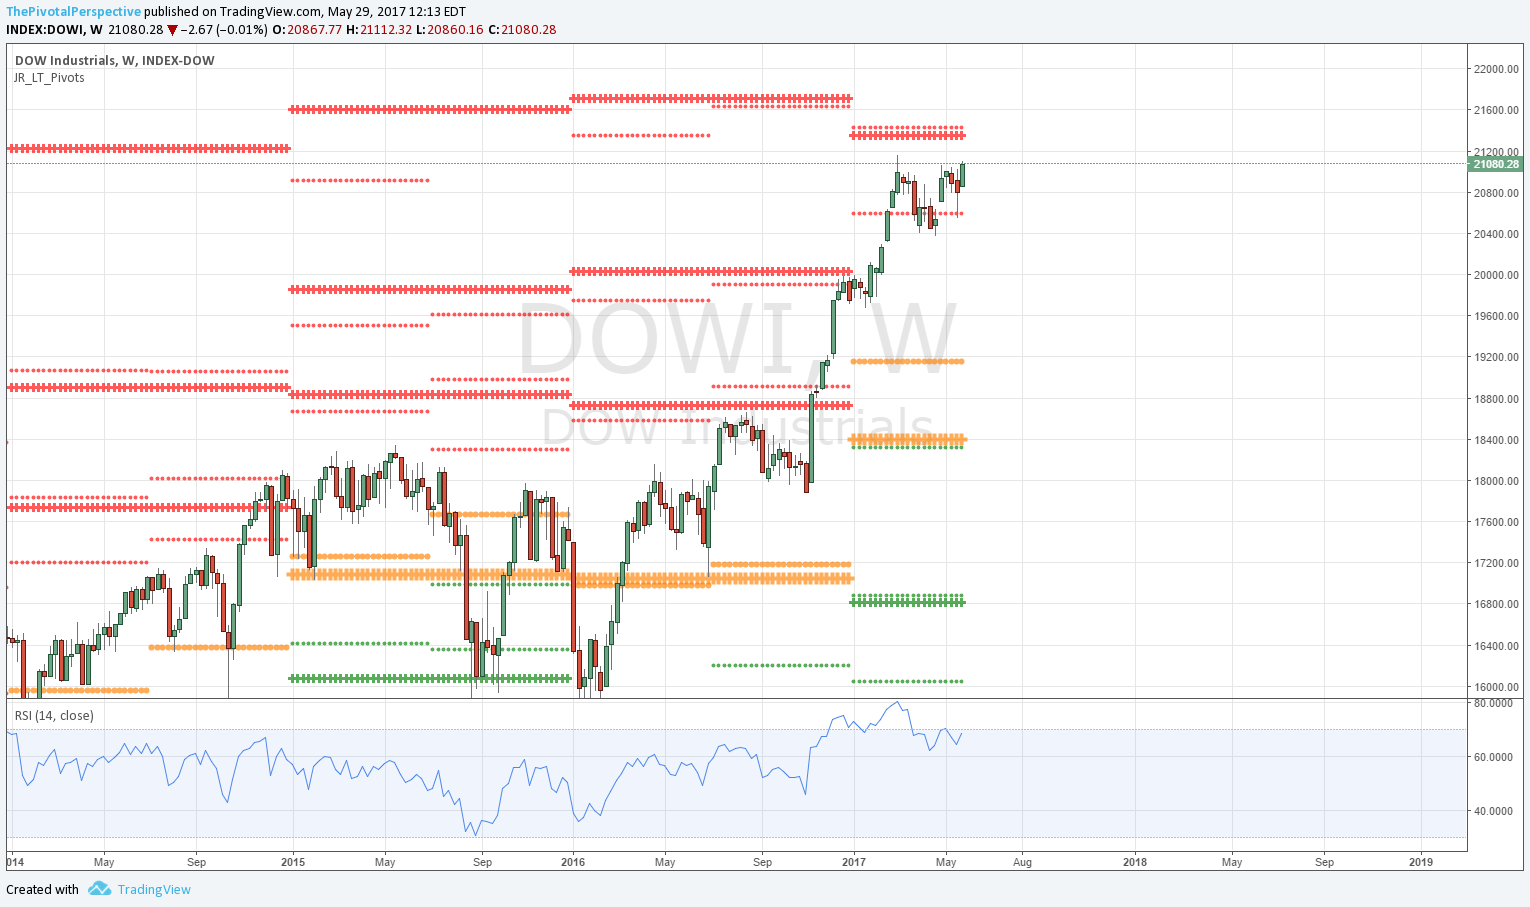
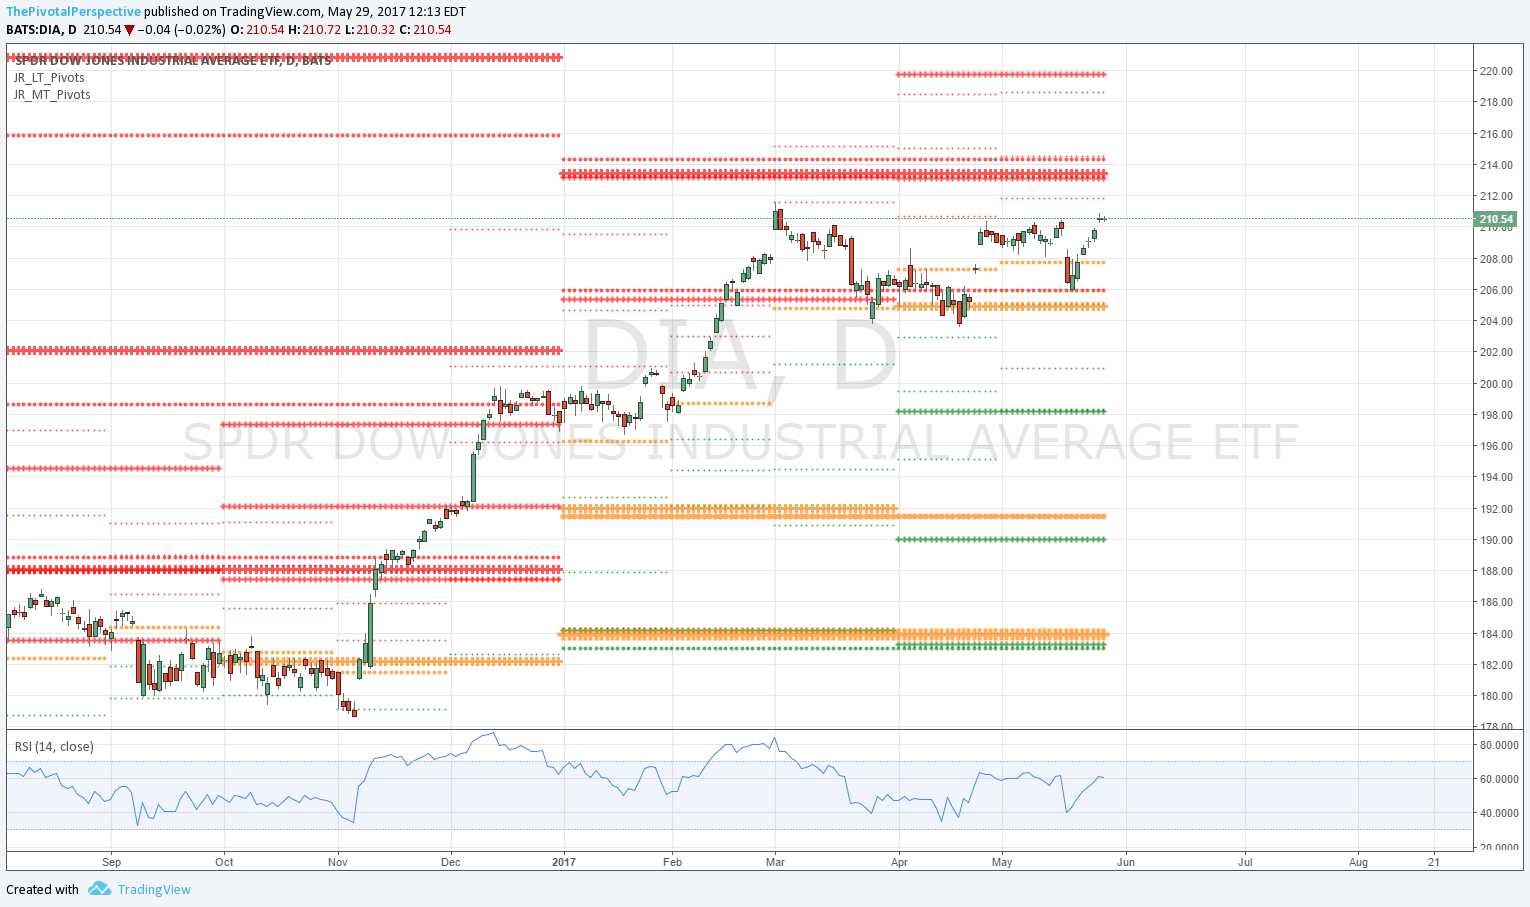
Markets continued higher with SPY above Q2R1, QQQ above Q2R2, and looks like DIA will be soon testing YR1 area.
SUM
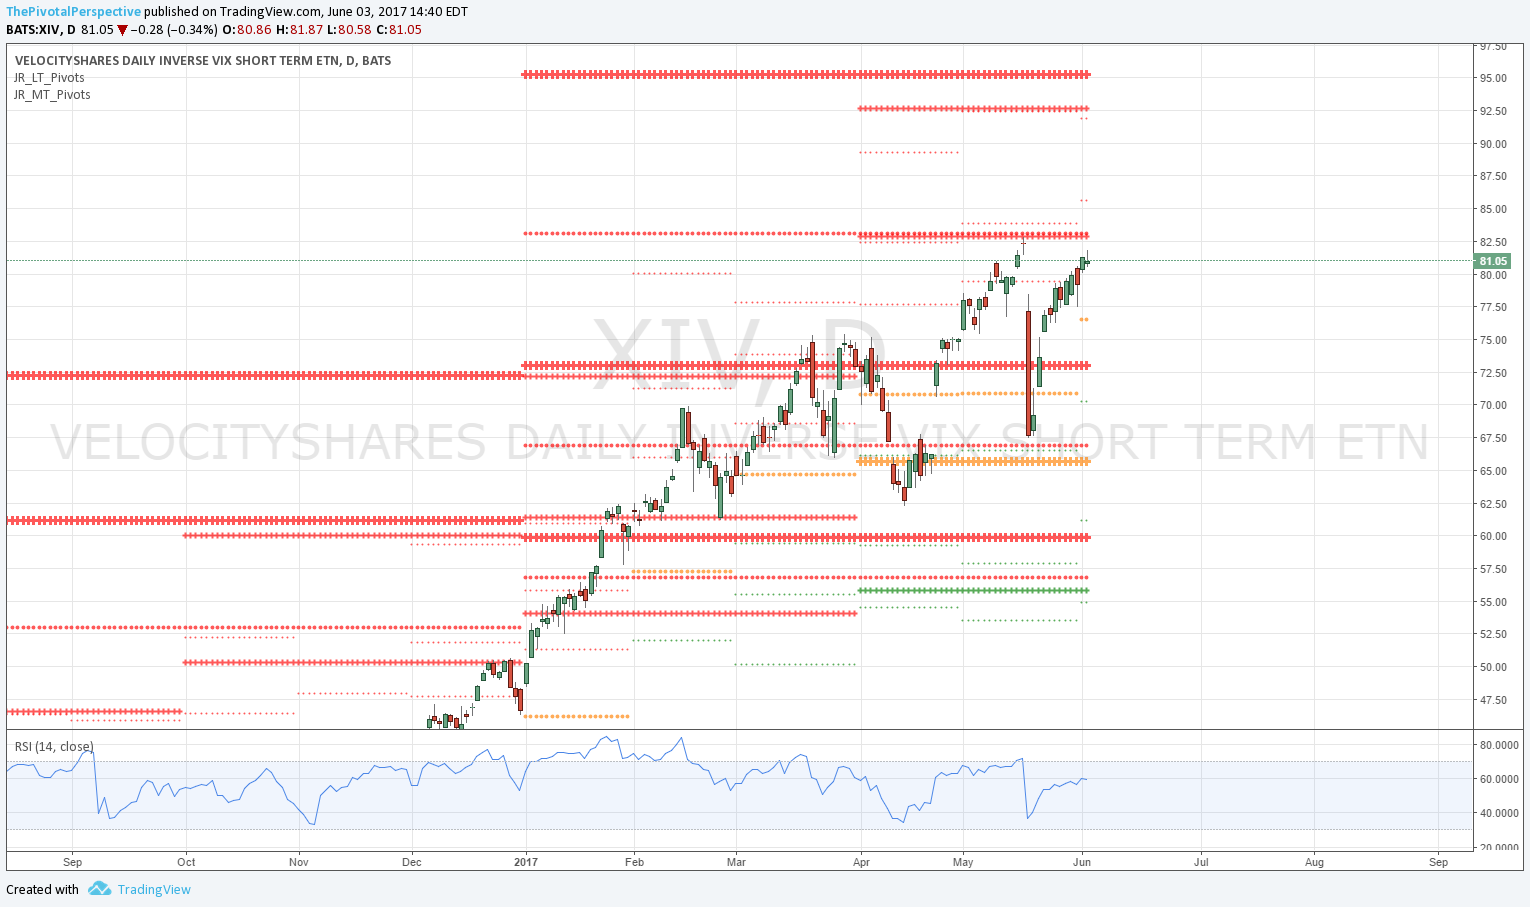
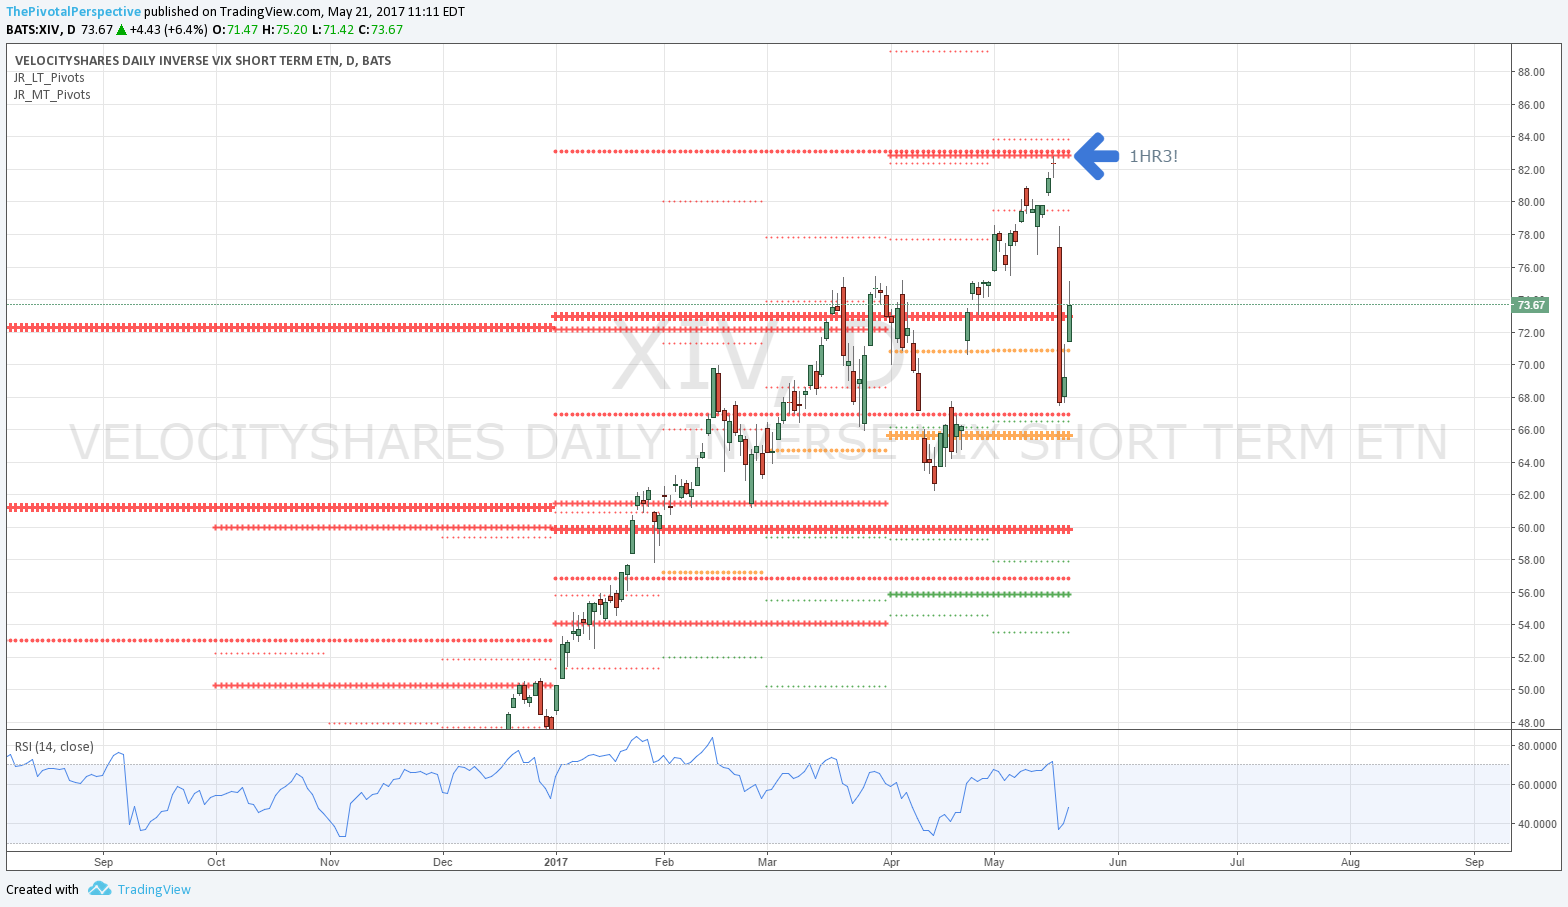
All 5 USA main indexes are above all pivots, with VIX below all pivots (and not showing any caution signs) and XIV above all pivots. This basic configuration is very bullish for risk assets. In addition, 3 of 5 USA mains just cleared significant levels - QQQ jumped above Q2R2, and even more important, SPY cleared YR1 and VTI traded above YR1 for one day. Tops begin with rejections - not clearing - of levels. As long as these maintain, markets are doing fine.
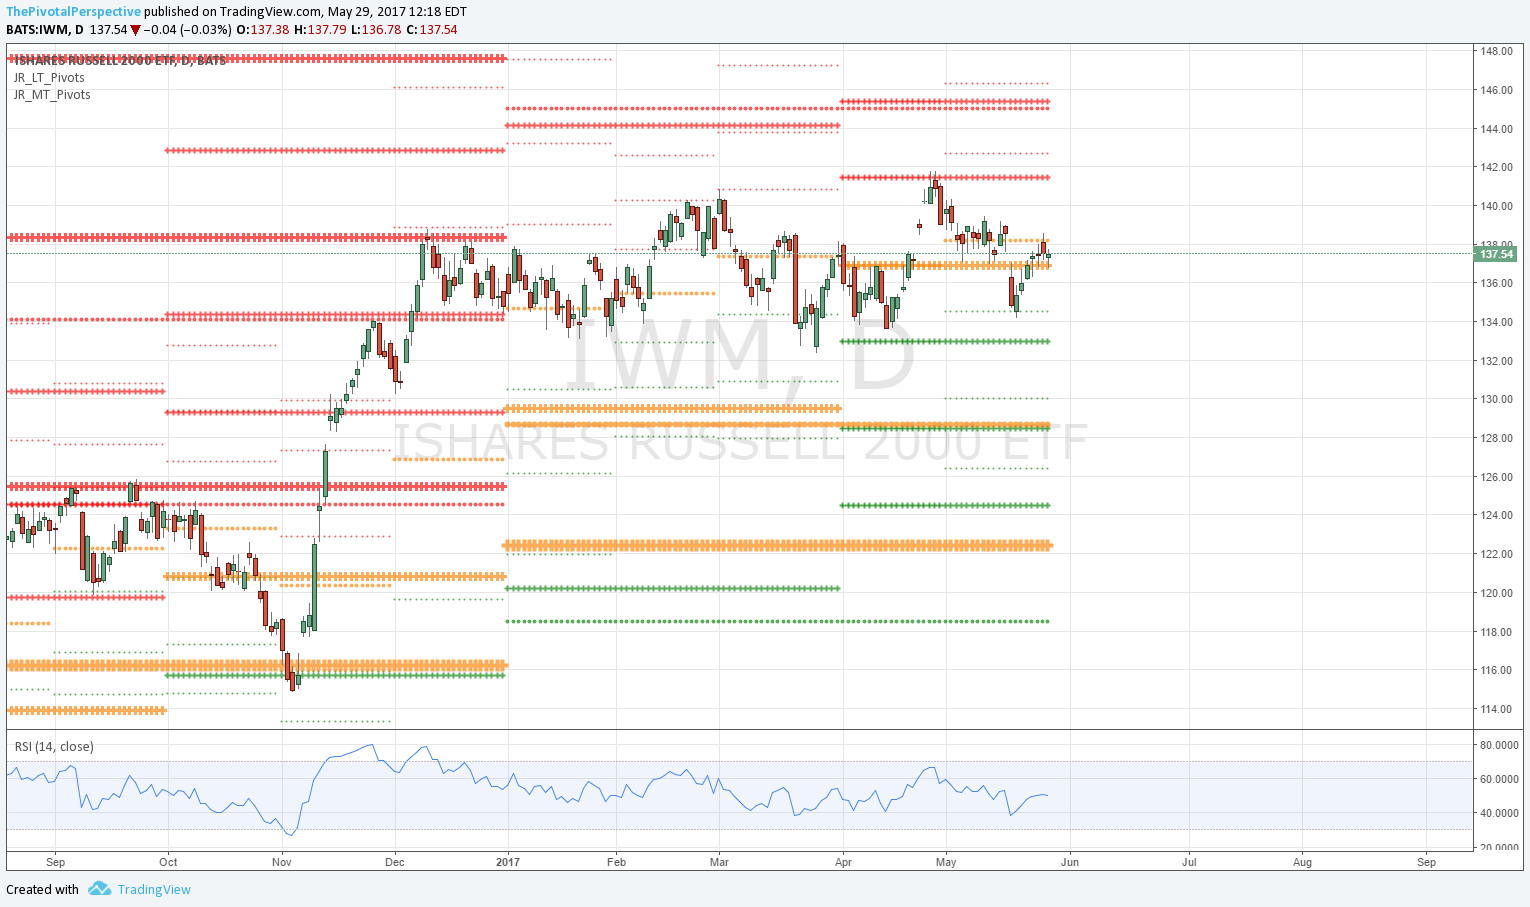
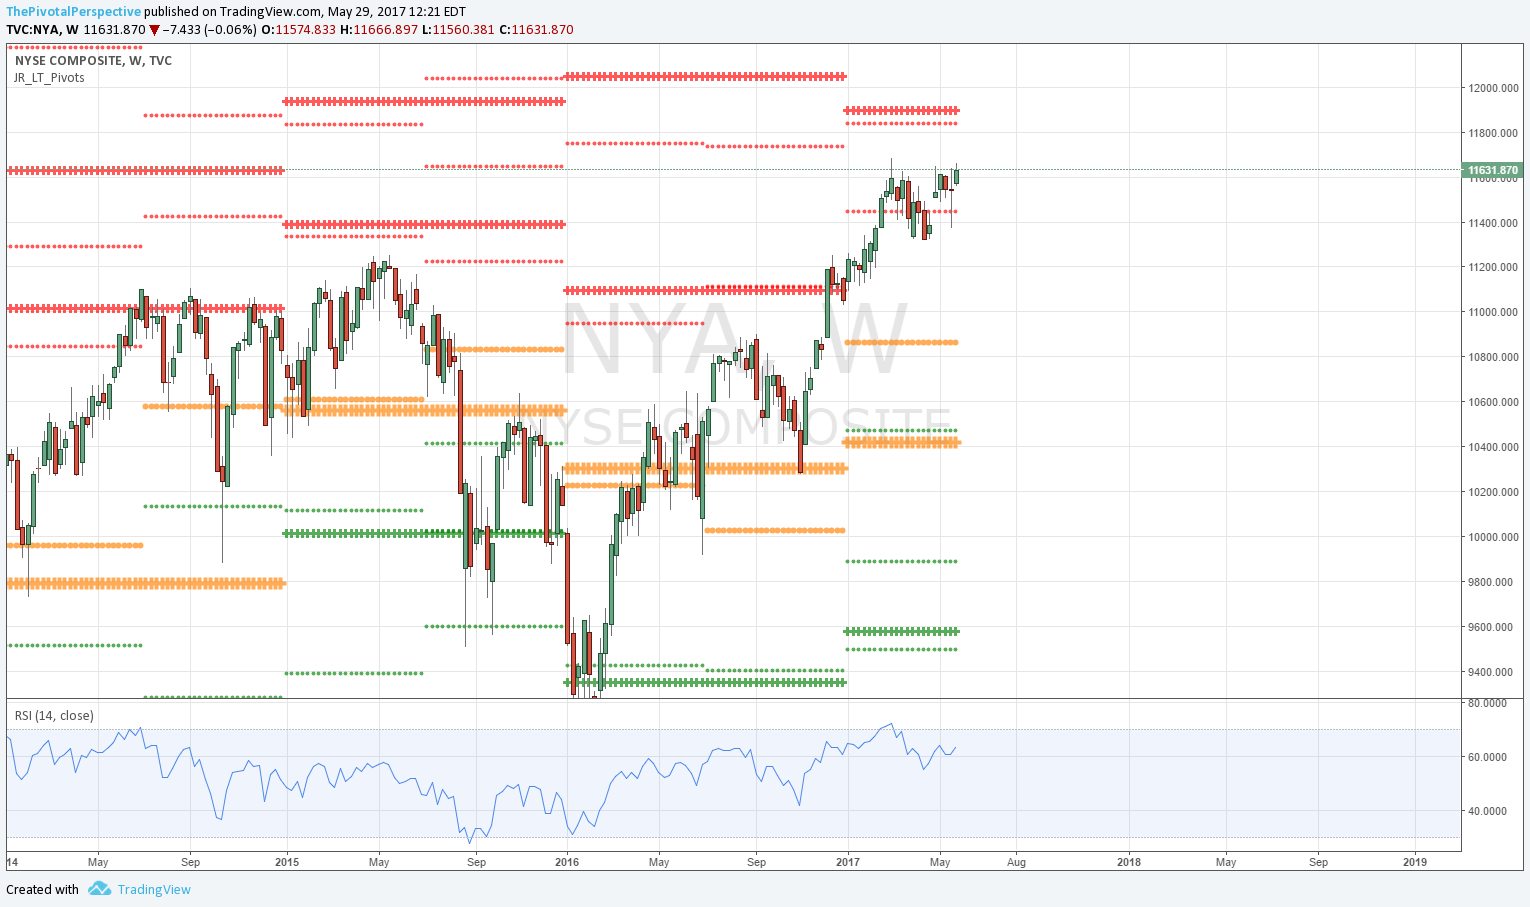
Next to watch will be DIA set YR1 area, which is a cluster of YR1, 1HR2 and Q2R1, in addition to IWM Q2R1 and NYA Q2R1.
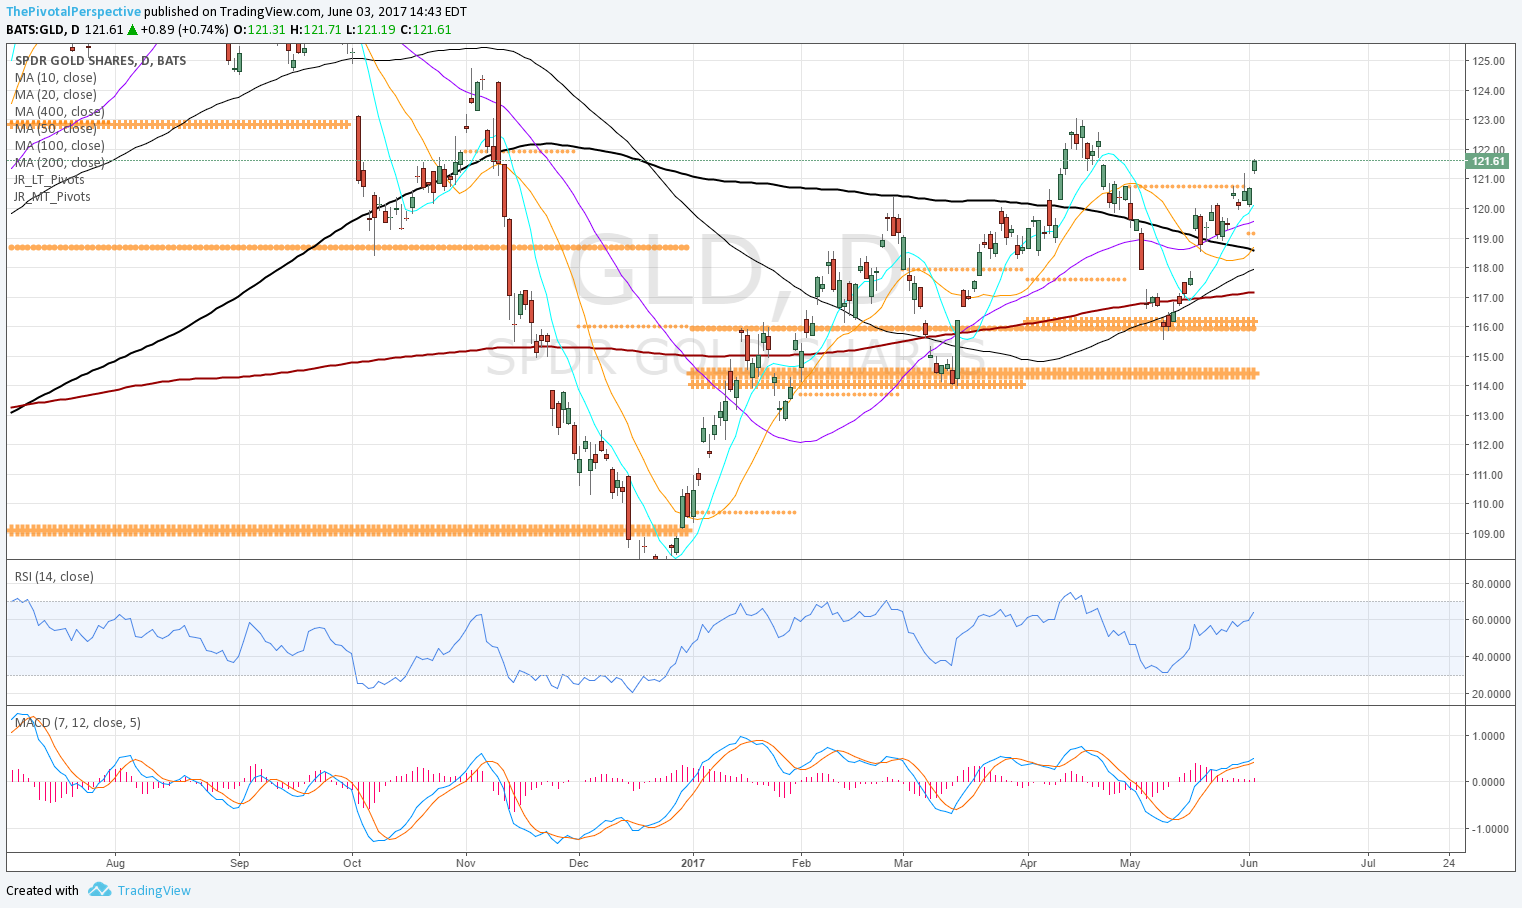
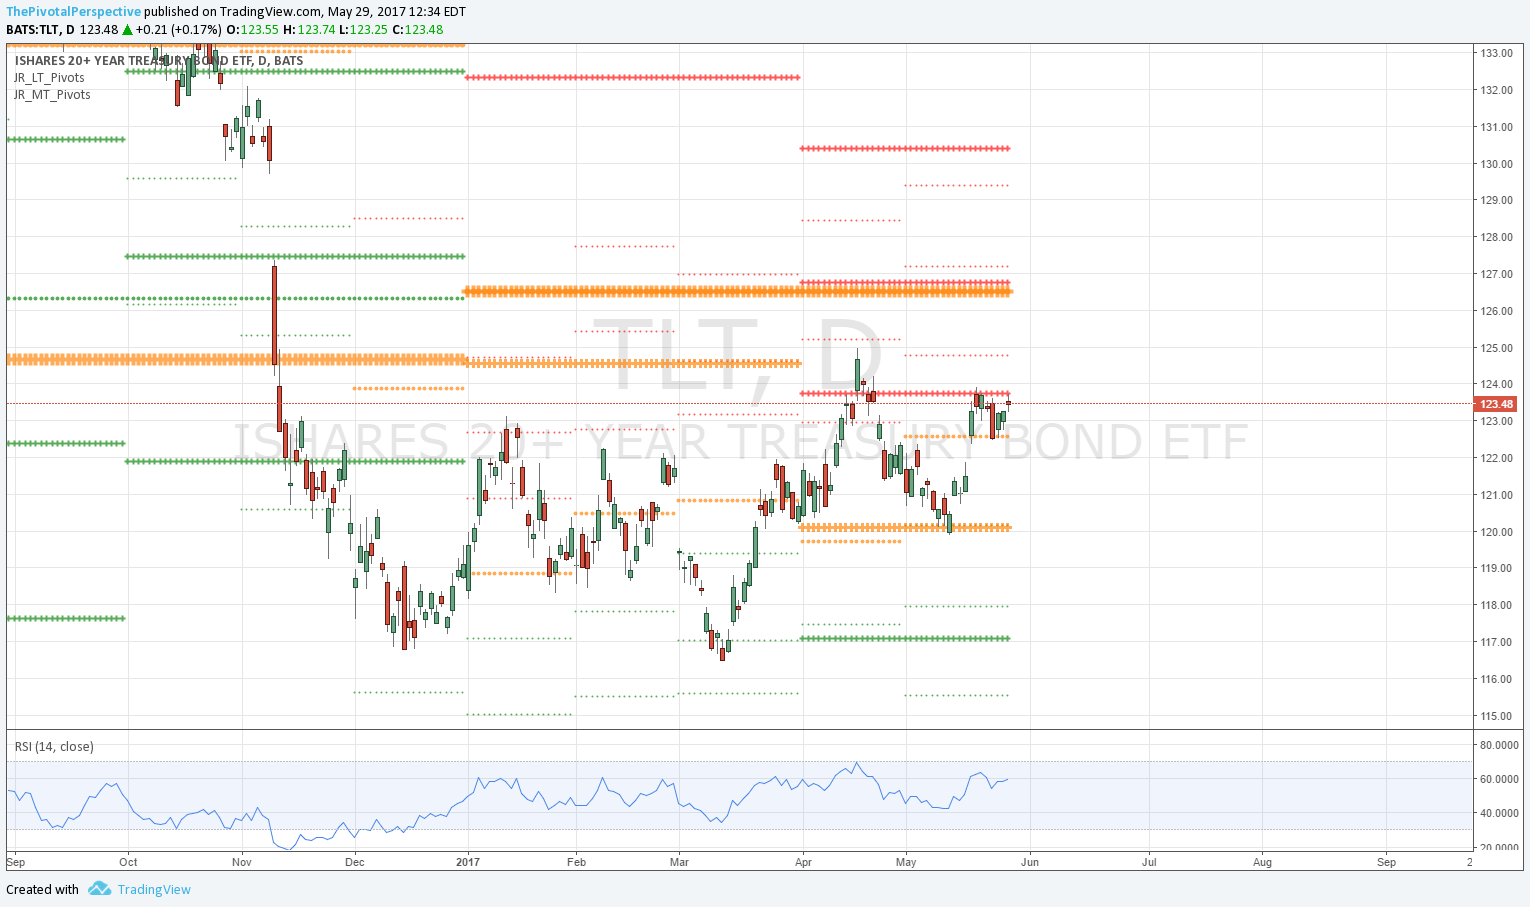
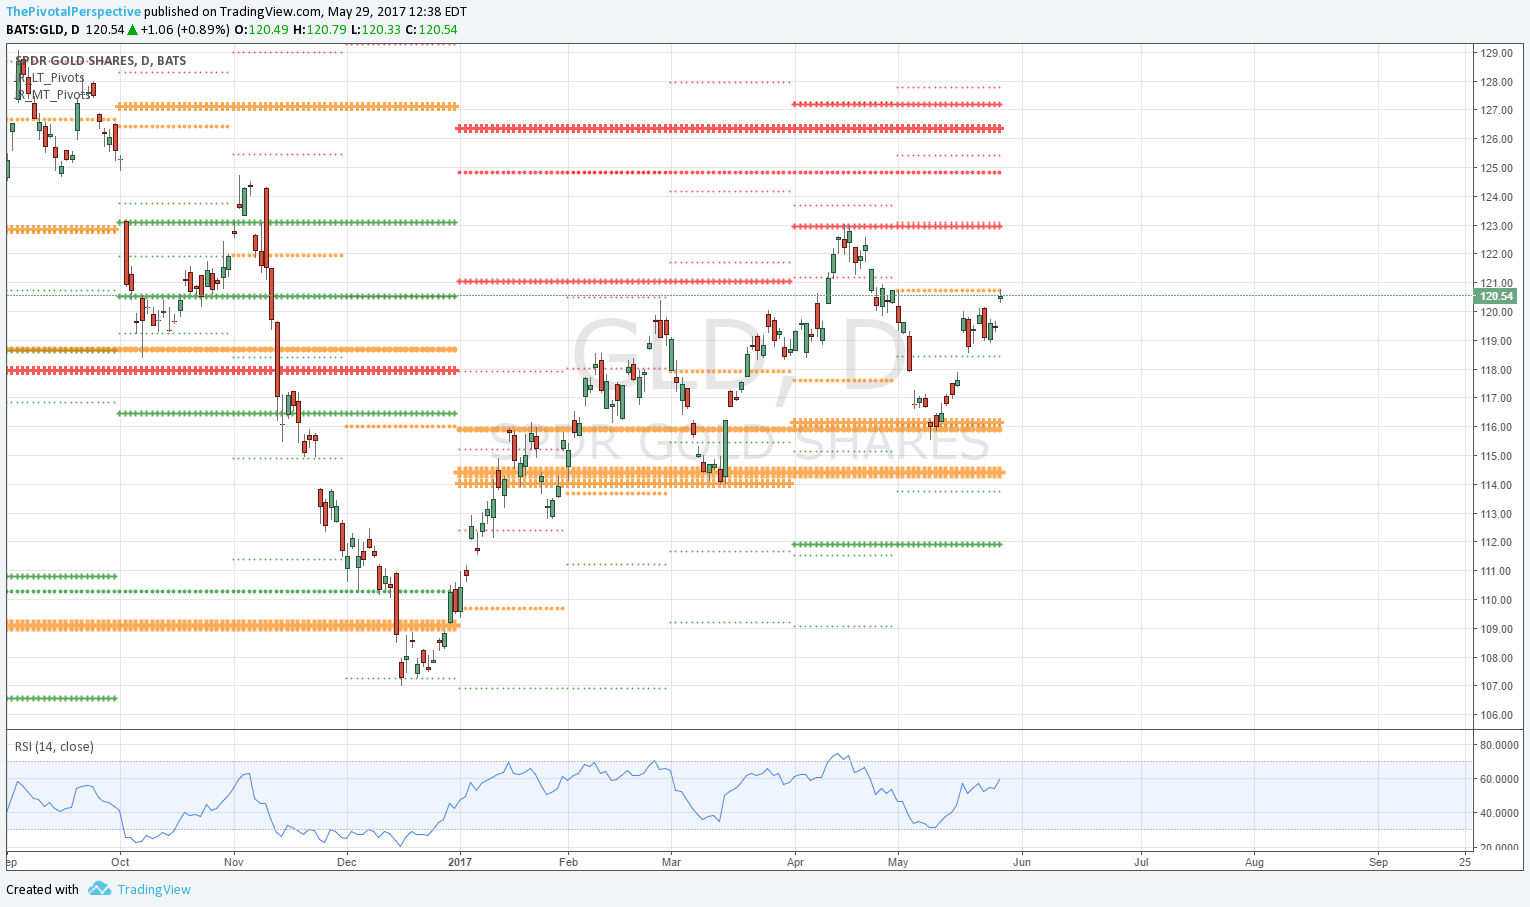
Other safe havens are of some concern. TLT is making a move, and AGG (key benchmark bond index) is above all pivots, joining GLD above all pivots as well. Until trouble shows in VIX and XIV however, and we see resistance level rejections on the indexes, I'll maintain full positioning. But safe haven strength is a reason to not be leveraged and still be a bit more skeptical of the recent move.
Another thought - at some point in June we may see professional re-balancing move. This would imply tech slowdown and and possible bid in energy, the weakest S&P sector this year. Not sure where IWM & XLF fall in this picture however.
Bottom line
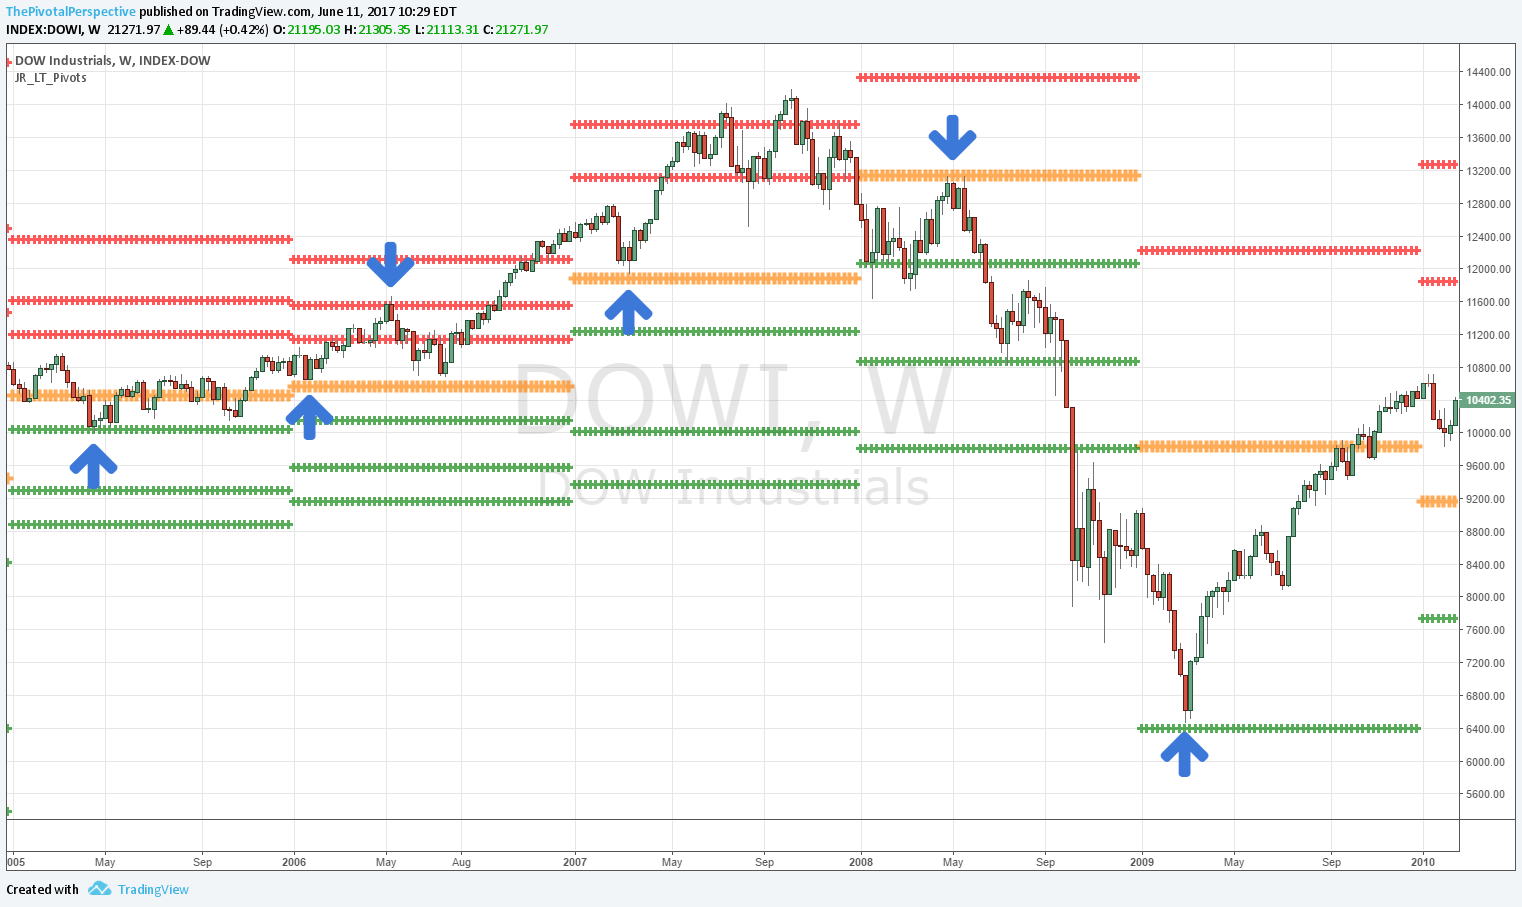
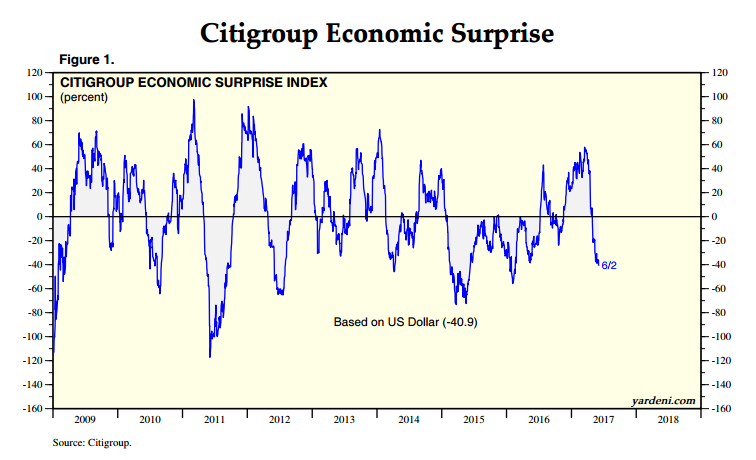
Despite plunging economic data, full valuation and strength in safe havens, markets are still doing totally fine. I have been skeptical of the bounce from 5/19 but bulls proving me wrong with easy clear of QQQ Q2R2 and SPY Q2R1, along with SPY big jump above YR1. But there have been many historical turns on Dow levels and cluster of YR1 / 1HR2 / Q2R1 combo is next to watch. See USA main section below for the actual numbers.
Positioning
Back to 100% long on 5/22-23 with SPY concentration, and I held off adding shorts back on 5/30-31. This turned out to be the right move. No change since 5/23 so previous positioning post still valid.
From the bigger view, it has been a huge mistake to not rotate more into QQQ as main index leader as I have actually been using that terminology ("2017 main index leader") from mid January.
PIVOTS
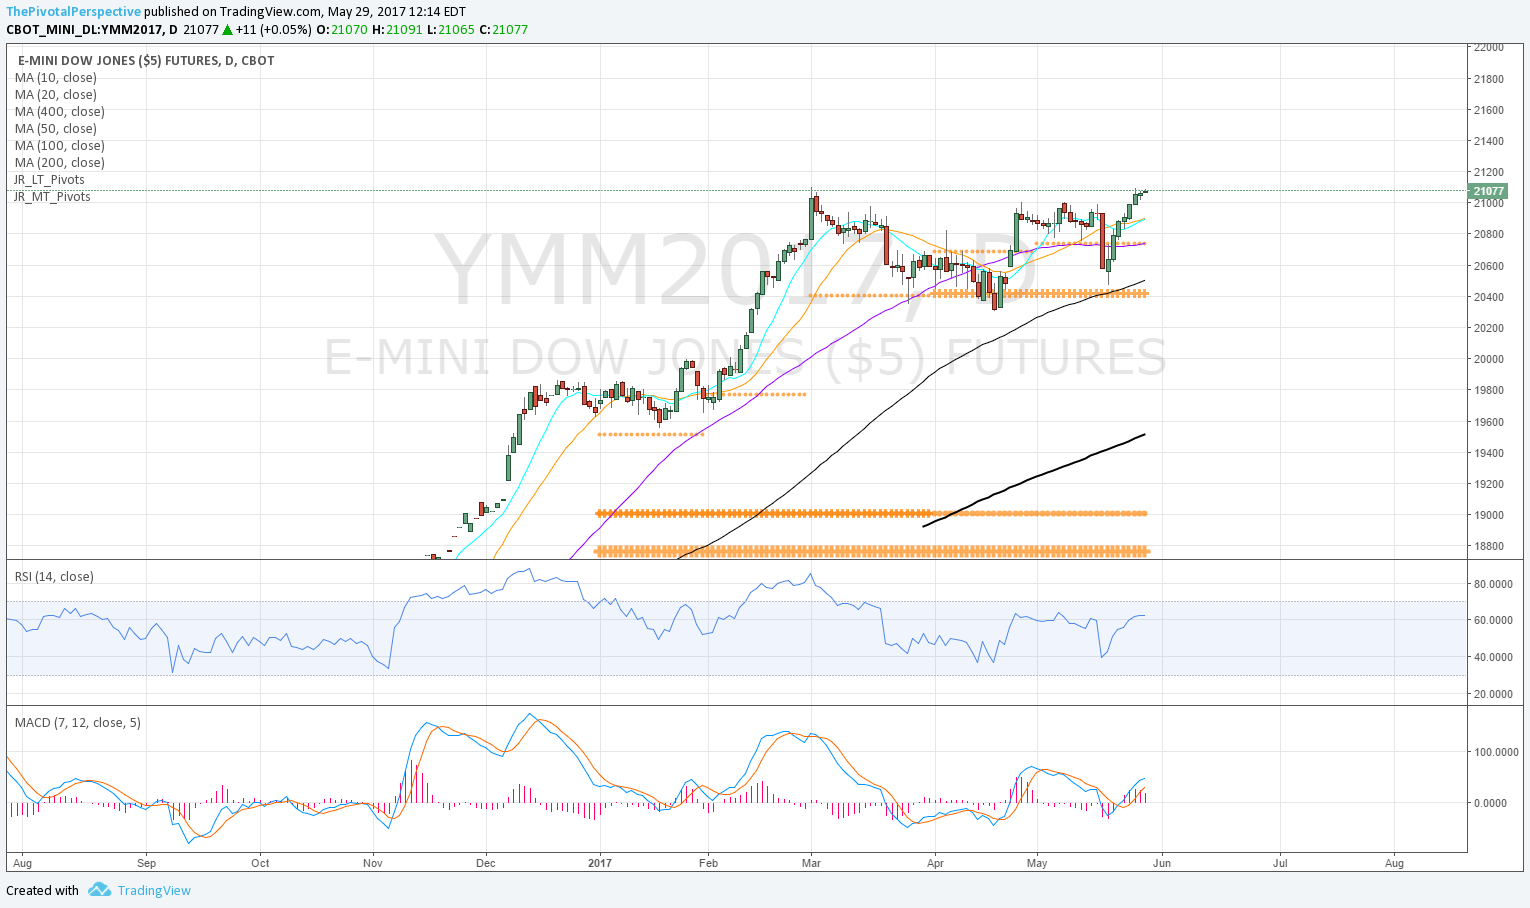
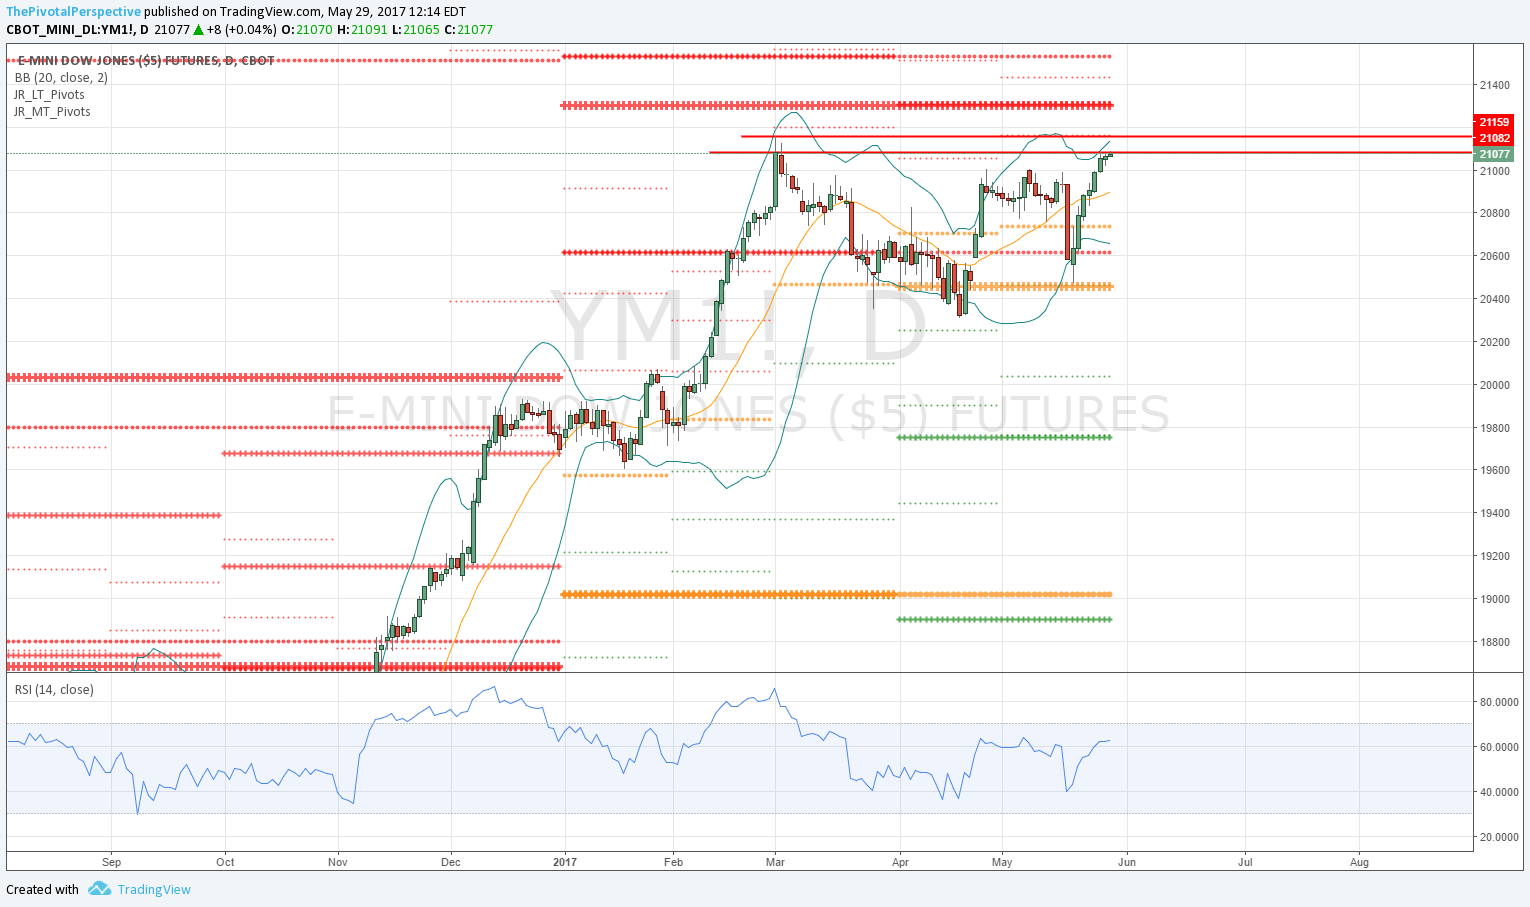
USA main indexes - SPY set above YR1 is big picture bullish. Now watching INDU & DIA YR1 / 1HR2 / Q2R1 cluster.
INDU levels: YR1 21349, 1HR2 21428, Q2R1 21328.
DIA levels: YR1 213.43, 1HR2 214.30, Q2R1 213.05.
Safe havens - VIX and XIV doing fine, but GLD and AGG above all pivots does not imply indexes continuing to soar and ignore overbought conditions. TLT soon testing YP also interesting level to watch.
Sectors of note - Despite broad strength, XLF well below Q2P and just fractionally above JunP. XLE 3rd break of YP was the definitive one, below all pivots as of 5/24. This is also showing how a long term investor can use pivots to overweight & underweight, with XLE below 1HP on a weekly close as of 2/13 week and clearly below YP as of 5/22 week. SMH continuing along with tech as the power trade of 2017.
Global stocks - Looks like profit taking on KWEB YR2 area. INDA and EEM at highs, FXI higher on recent move. Oil taking toll on RSX and EWZ. SHComp 2 breaks of YP and 2 comebacks thus far.
Currency & commodity - $DXY moving as expected after "screaming bearish" call on 5/17. USO below all pivots - if we do see pro re-balancing move, then at least it will be able to get above JunP.
OTHER TECHNICALS
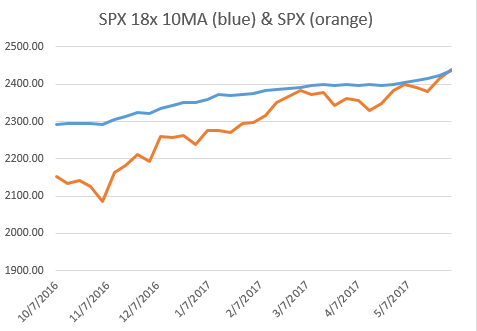
RSI on SPY
Quarterly chart - 79.3 with no divergence, very healthy as RSI overbought on Q charts is what happens in bull markets.
Monthly chart - 74.6, also looking good.
Weekly chart - 71.7, jumped above to overbought for only the second time since 2014 (first was weeks after election).
Daily chart - 70.3.
I just don't see how this is sustainable - all charts in overbought territory means more likely move is sideways or down.
Also, SPY daily chart close outside its Bollinger band and weekly chart pushing the band. Only two weekly bars this year tagging the band and one of them was last week.
VALUATION AND FUNDAMENTALS
Mixed bag here - I think this implies more sideways than continuing to trend up.
SENTIMENT
2 of 4 indexes at extremes as of last week, but even that not enough to prevent stocks from rallying.
TIMING
(Proprietary work in progress model)
May dates published in 4/30 Total market view:
5/3-4 - stock index minor pullback low on 5/3
5/19 (stronger) - stock low 5/18 (-1)
June dates (published in 5/29 Total market view)
6/9
6/15-16
6/21-26
In addition, a larger timing cycle points to momentum slowing in risk assets from 6/5 into July.