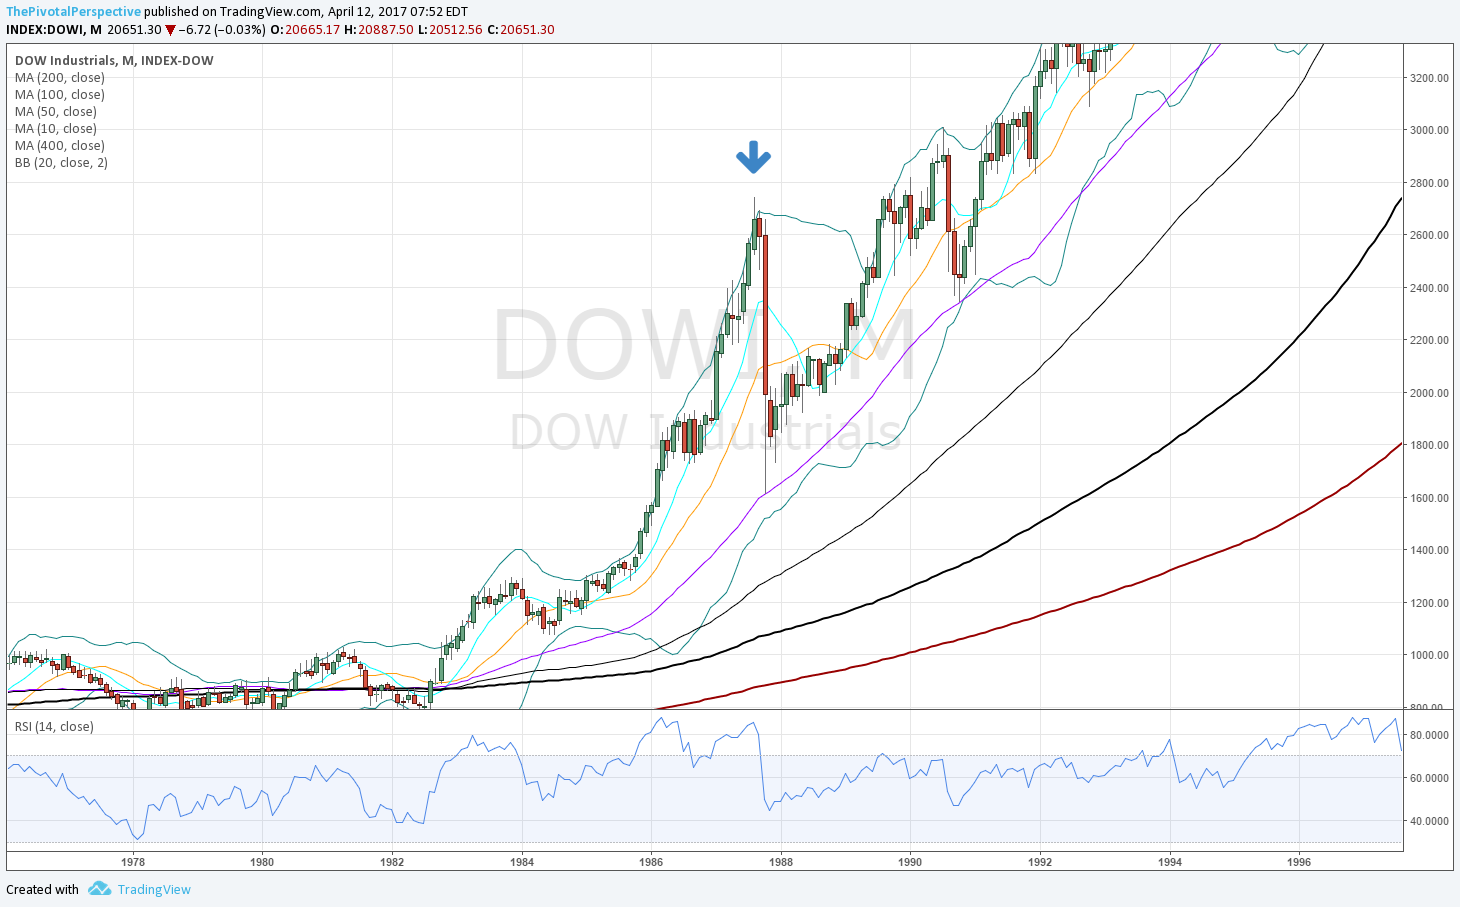
Of course, 1987. This was a real scar for people due to sheer velocity, even though hindsight makes it so much easier with full recovery 2-3 years later.
Again this is important for what is not on this top.
Quarterly chart RSI blowoff levels near 90? No, only 1 bar at 86 and others under 85. This is not so high compared to the other historical blowoffs like 1929, 1989 Nikkei, 1999 NDX, etc.
Q chart BB or RSI divergence? Nope.
M chart BB or RSI divergence? Nope.
Pivots? A bit helpful, with YR2 rejection. 2 weeks later down to YP that held. The next year back above YP and rally resumed!


