Total market view

Review
1/1/2017 Total market view Sum: "Heading into the new year, quarter and month, the question is whether the market continues the larger moves since election (USA stocks up especially DIA, IWM and XLF, $USD up, rates up, safe havens TLT and GLD down, global stocks mixed) or if we see some re-balancing move. Re-balancing would imply pullbacks on what currently looks best and buying on what looks the worst. I don't know what will happen but will let pivots guide decisions."

The result was that we did see some re-balancing moves with IWM weaker and QQQ strong, TLT and GLD bounce, global stocks up and DXY down. But at the same time, all 5 USA main indexes are above all pivots and that is the place to be. 

Sum
All USA main indexes are above all pivots, with long term resistance much higher. Tech looked weaker in comparison to the others at the end of December 2016 and it has jumped the most to start the new year. Safe havens TLT and GLD did get some bounce and recaptured JanPs, but still below YPs, 1HPs and Q1Ps. VIX is below all pivots. This is a bullish configuration for stocks. 

Obviously a lot of people with buying power on Wall Street have been very happy about the Trump win. Even though I saw one post saying "buy election sell inauguration" I think the more likely move is follow through buying after 1/20. There is nothing to stop the Republicans from doing everything they want to do, and I expect the first reaction will be cheering from Wall Street, not an immediate fade. If this idea correct, then holding longs will be the right move. 

Bottom line
If indexes are higher then it will be easy to hold. If lower then IWM likely to break its JanP before others and portfolio can come back down to market weight or lower but reducing on those positions. 

Positioning
Each adjustment was recommended in advance as a setup or stop or day of in daily comments based on pivot action that day. Back to market weight long on 1/3 then even longer through the rest of the week. 

Pivots
USA main indexes - Above all pivots, with QQQ on Q1R1 already, SPX and NYA/VTI both on JanR1s.

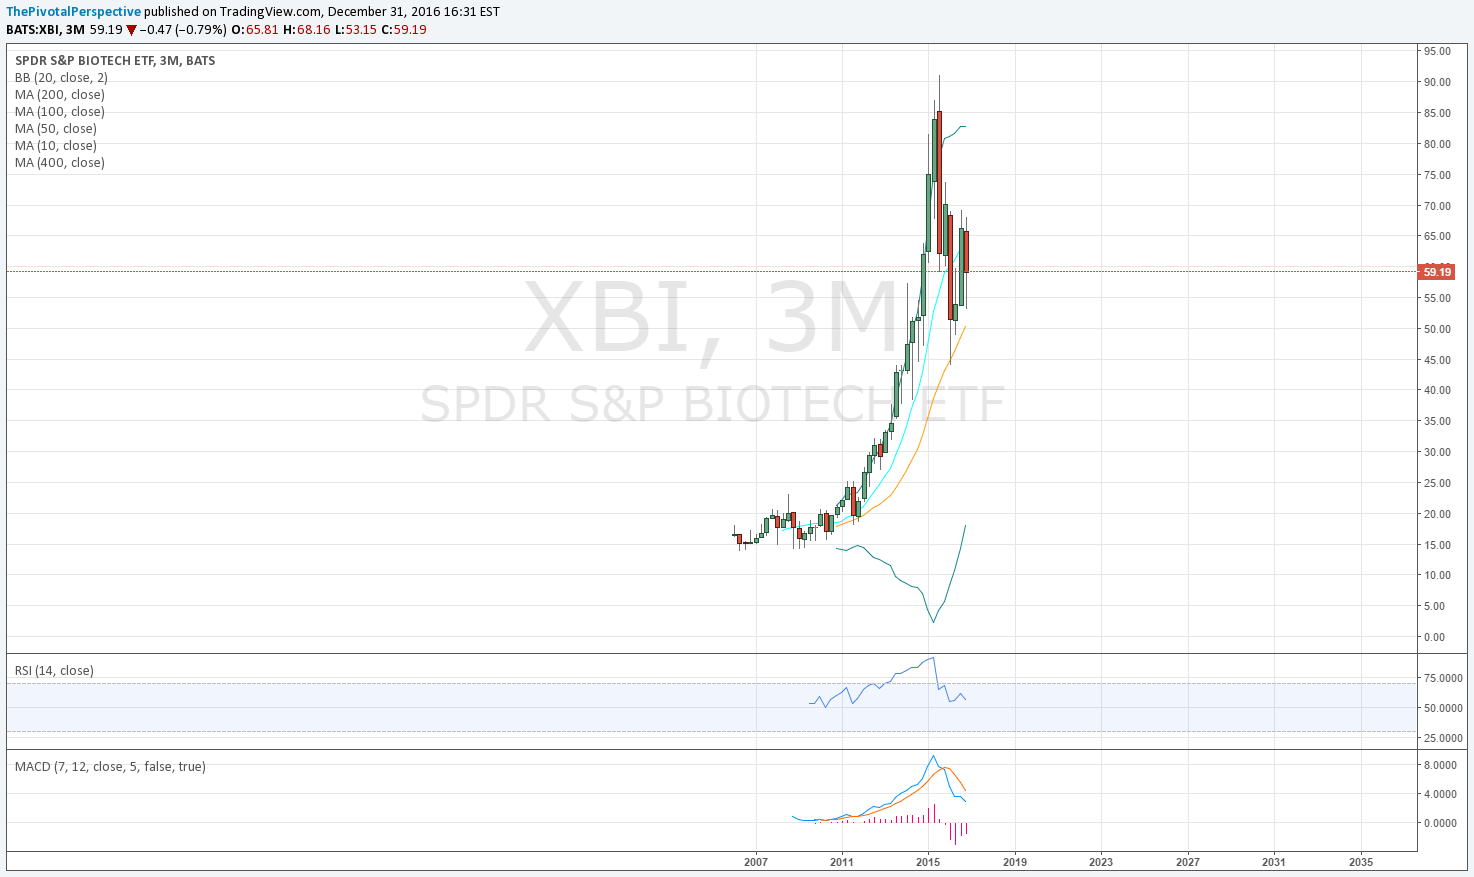
Sectors of note - XBI above all pivots for the first time since 7/2015, hence the buy recommendation on 1/4. (Too bad I didn't apply same idea to EFA on 1/3 in daily comments as well.) XLF not down despite massive run up after election and perfect hold of JanP thus far. 

Safe havens - TLT and GLD above JanP but below everything else. VIX below all pivots and even under JanS1. XIV a bit more toppy at Q1R1. 

Global indexes - EFA above all pivots for the first time since 8/2015 as of 1/3/2017 means developed markets bullish. RSX, EWZ and EWZ above all pivots; FXI below Q1P but above 3 others; INDA mixed below 1HP and Q1P, but above YP and JanP.

Currency & commodity - DXY 1 day break of JanP and recovery above all pivots. EURUSD same but below (ie 1 day above JanP and immediately back under all pivots). CL1 (oil continuous contract) above all pivots. 

Other technicals
Does Dow 20K matter? 

Also, gold looking more and more useless. 

Valuation and fundamentals
Currently a moderate positive with 18x-20x target range 2360-2622 which nicely lines up with SPX YR1 at 2407.

Sentiment
Extremes reached near 12/8, but thus far backing off without much damage to price. 

Timing
January dates published 1/1
1/4 (strong) - so far 1/3 DXY high and that's it
1/6-9 - TBD
1/17-18
1/28

Positioning

Last week start:

3 IWM, 2 DIA
3 XLF, 1 QQQ
9 longs or 90%

2 IWM short hedges
1 FXI short
3 hedges / shorts = -30%

60% net long, 10% cash. 

Adjustments
1/3 take off 2 IWM hedges, buy 2 SPY for 11 or 110% longs and 1 remaining FXI short for 100% net long
1/4 buy 1 XBI for 110% net long
1/5 cut FXI short for 120% net long

Ending week
3 IWM, 2 DIA (both from near election)
3 XLF, 1 QQQ (pre & post election)
2 SPY from 1/3
1 XBI from 1/4

12 longs or 120% long, no shorts. 

Positioning limits
15 or 150% long, -50% shorts or hedges, 200% max total exposure. 

Currency / commodity positions are not included in this system. 


On gold

There has been quite a lot of chatter about bitcoin recently and it is making it quite obvious how useless gold is as a currency in comparison. Hard to store, hard to carry and very few places can make change for it. Like so many elements of society, technology is replacing it with a different digital version - paper money, books, photos, the list goes on and on and on. 

Here is daily bitcoin/USD vs GLD in red. I purposely picked the start of 2016, because the few months that GLD outperformed BTCUSD was one of the best rallies in GLD in years. And remember BTC would look even better against other currencies like EUR and especially CNY/CNH.

GLD (not posting charts)
Quarterly chart - below 10MA and falling 20MA
Monthly chart - below 10MA, 20MA, 50MA, 100MA and not oversold
Weekly chart - below 10MA, 20MA, 50MA, 100MA, 200MA, recovering from oversold
Daily chart - above 10 and 20MA, below all others

So the recent move is most likely a bounce in a downtrend. If GLD stays under its YP at 114.41, then if The Pivotal Promise delivers we will see 97.68. That is a nice risk reward with it currently at 111.75 and could get even better if GLD is able to rally further. 

Safe havens

Sum
TLT and GLD getting re-balancing and/or oversold bounce. But until both recover at least a quarterly pivot, trend is more likely to return lower. VIX is below all pivots. While we are seeing levels that often pay to be on guard, VIX staying under all pivots is bullish for stocks. XIV a bit more concern with tag of Q1R1 so watch that next week. 

Charts
Weekly with long term levels only
Daily with long term  medium term
Daily with pivots only (no support or resistance) and moving averages for entries

TLT
Below YP/1HP combo with long term support far below.
Daily chart shows recovery of JanP, but rally stopped cold at the D50MA.
TLT sum: Bounce in downtrend, still below YP, 1HP and Q1P. Holding above the JanP means it could go higher, but I will keep to overall bearish view below the Q1P.

GLD
Weekly below long term pivots. Daily recovered JanP as TLT did. Nice pivot cluster possible short setup with YP and Q1P both in 114s.

GDX
Stronger than the metal and right now above YP Q1P combo. Still below 1HP and falling 100MA. Under the YP could consider short. I'm not thinking long due to weakness in GLD. 

VIX
VIX down in 11s and even into 10s a bit last week. It usually pays to be on guard at these levels, but anything below 13.20 is still under all pivots and therefor strong for stocks. 

XIV
Already at Q1R1!

USA main indexes

Prior week: "Selling pressure from key (2016) resistance at SPY YR2 near tag, NDX YR1 bang on, INDU YR2 very near tag, RUT YR2 exact."

Last week: All USA indexes opened above all pivots. Tech set reached Q1R1; SPX and both NYA & VTI reached JanR1s. 

Sum
All USA indexes above all pivots. Tech set Q1R1 and SPX, NYA, VTI JanR1s the levels to watch for the coming week. If higher then we'll see indexes above those levels or at least no selling pressure. If lower then first support is IWM JanP, which probably will be first to break given current configurations. 

Charts
Cash index weekly charts with long term levels only
Daily ETF chart with long term & medium term pivots
Futures current contract pivots only (no S/R) and MAs for clarity of entries (now March 17 H)
Futures "1" continuous contract with the works

SPX / SPY / ESH / ES1
Even though SPX looks to be bumping up against resistance, that is really the 2016 level. 1HP is 2196 and first long term resistance is 1HR1 at 2319. The YR1 is valid target with SPX above its YP at 2407.
SPY shows near tag of JanR1.
ESH shows re-entry or continuation setup of move that began on 11/9, and above all rising MAs.
ES1 JanR1 near tag, upper band, but RSI not yet overbought. 
SPX sum: Long term looks great, medium term some reaction possible at the JanR1s and upper daily BB.

NDX / QQQ / NQH / NQ1
Weekly chart above pivots and plenty of room to resistance.
Daily QQQ at Q1R1 already!
Futures Q1R1 level is higher due to 11/8 night spike. 
NDX sum: Healthy, but already at quarterly resistance so watching how that reacts. 

INDU / DIA / YMH / YM1
Weekly chart above all pivots, 1HP 19154, 1HR1 20595 and YR1 21349.
Others look like room to go higher; only some RSI divergence on the YM futures chart. If this were to drop, JanP decent support. 

RUT / IWM / RJH / RJ1
Above all pivots but weekly bar doesn't look as strong. If lower probably the first to break JanP. Holding the status of above all pivots is better for the market. 

NYA / VTI
Above all pivots, near JanR1 tag on NYA. Similar on VTI. 

Valuation and fundamentals

Thomson Reuters SPX 12 month forward P/E dropped a bit while the the index rallied. To smooth out the noise in this indicator I have been using a 10MA, which has actually been under 17 since the election despite higher prices. This means earnings estimates are increasing, and the 10MA on that number has risen from about 127 to above 131. 

The 10MA of 18x-20x valuation target are up to 2360-2622, or 3.6% to 15.2% upside from current price levels. These will continue to change as earnings and the 10 week moving average also change.

*

Citigroup Economic Surprise Index is maintaining in positive territory. 

My interpretation is that these are moderate positives for the market. Higher valuations sure, but not yet at wild extremes. Economic reports coming in on the positive surprise of things is positive after 18 months below zero last year. 


Do round numbers matter?

Asking for a friend. But seriously, a work colleague is asking - what's the deal with Dow 20K?

I think this is just a psychological thing and mostly a function of media like CNBC acting as cheerleader for the market. It is also a bit like Y2K (for those old enough to remember all the dire computer crash warnings) or turning 30 or 40 or 50 etc, although 20 doesn't seem to be in quite the same league as 16 or 18 or 21. The later three can all be explained in legal freedoms and after that, a lot of people have a thing for the round number decades. But do these matter for stock market prices? Let's look at charts. 

I'm keeping with the Dow here because that is the media circus, even though there is far more volume and trading activity in the S&P 500. In each chart below, 1 bar represents 1 week of price action and the red lines are the round number levels (or close as I could get them to draw).  

Sum
Sometimes round numbers matter, sometimes they don't. Sometimes they are clear resistance, sometimes there is chop. But what seems to be more reliable is that after the Dow clears a level, then later - like 1-3 years later - that level can act as support.

So Dow 20K could be this year's media broken record or maybe it blasts through and holds as support from there. Regardless, I don't think anyone should use this level as part of a decision to buy or sell stocks. There are too many incidences of whipsaw to make any round number in and of itself a reliable strategy.

Weekly chart, 1980-85
Dow 1000 was a thing. Pretty clear resistance and sizeable drop; then once it recovered and acted as support, it was definitive.

Weekly chart, 1985-1990
Dow 2000 didn't matter that much. 2500 was in play somewhat in 1989-90, first as mild resistance then later as clear support.

Weekly chart, 1990-95
Picture perfect tag of Dow 3000 and a drop to near 2500. But what a nightmare in 1991, with media probably going on about Dow 3000 all year - above, below, above, below, ARGH! After all those months of indecision in 1991, Dow 4K was decisive one shot key high in 1994.

Weekly chart 1995-2000
Round number levels are coming much faster now, which makes sense because the percentage move is much less. Dow 5000 support in early 1996; Dow 6000 not really important; Dow 7000 some resistance for several weeks in 1997; thin line Dow 7500 important for all of 3 weeks; Dow 8000 some resistance, kinda, with a few fake-outs above; Dow 9000 same. Then look at that, the level that didn't really work at Dow 7500 became perfect support in 1998; now Dow 10K, almost non event the first time, but that number did act as support later in 1999.

Weekly chart 2000-05
Dow 11000 an exercise in frustration, but decent bounce off Dow 10000 a couple of times. Key lows again at Dow 7500 in 2002-03, and 9000 acting as support for a few weeks. But Dow 10K later in 2004 was non-issue.

Weekly chart 2005-2010
Dow 11K resistance then 10K support in 2005; in 2006 it didn't matter. Dow 12K support in 2007, then 13K not important, but what do you know, 14K very important! 12K support in early 2008, 13K resistance, then crashola all the way down to 7K again. In the recovery in 2009 Dow 9K non event, 10K some support in early 2010.

Weekly chart, 2010-15.
For each 1000 points above 10000, the percentage move is much less and so the market encounters round numbers with much more frequency. Dow 11K resistance, then 10K support. 2011 highs and lows not on round numbers at all. Then in 2012 perfect low on Dow 12000. Dow 15K chopped quite a bit, then 16K clear support in 2004 for several weeks.

Weekly chart 2015+
Again Dow 16000 decent support in 2005 for several weeks in three different clusters. Dow 17K not much. Dow 18000 struggled and after several fake-outs failed. Dow 19,000 was in the middle of a melt up move. And now we are at Dow 20K. What does it mean?

Total market view

Review
12/24 Total market view: "USA main indexes have rallied to yearly resistance on cash indexes and since then about sideways for 2 weeks. This lack of selling pressure increases the chances we will see a move back to those levels or above into year end."

Results
This was off as markets dropped further from resistance levels. But I didn't jump the gun on positioning changes and portfolio has been only partially long (down from leveraged long) from 12/12.

Sum
Heading into the new year, quarter and month, the question is whether the market continues the larger moves since election (USA stocks up especially DIA, IWM and XLF, $USD up, rates up, safe havens TLT and GLD down, global stocks mixed) or if we see some re-balancing move. Re-balancing would imply pullbacks on what currently looks best and buying on what looks the worst. I don't know what will happen but will let pivots guide decisions.

Unfortunately 2017 pivots do not show on charts until bars open so I did a thorough review of long term other technical charts instead. But let's keep the larger view in mind: 

USA stocks indexes are in healthy uptrends. On the USA main indexes, DIA and IWM both look fantastic. NYA is the weakest, still below 2015 highs. This is likely due to overseas components because the other broad index VTI looks about like SPY which also in a quite healthy uptrend across the board. QQQ while more threatening as a top is still in an uptrend, just 3 days off all time highs and above all MAs except the daily chart 10 and 20. 

In selected sectors, financials look great too. Semiconductors strong yet perhaps vulnerable, biotechs mixed condition, XLE perhaps upside limited but oil strength will support.

Safe havens TLT and GLD look terrible, and both have room to drop further.

DXY I think longer term will go up, but near term move less clear especially with EURUSD short squeezing above its 2015 low. Oil also healthy.

Global indexes that I track are weaker overall. China in trouble, impacting SHComp, FXI and EEM. INDA is relatively stronger than these three. RSX current momentum leader, and oil strength still supporting EWZ.

Simply stated long USA stocks is still the best place to be. USA indexes will be above most pivots as 2017 bars open, and safe havens below pivots. Barring a repeat of January 2016, this favors continuation of current trends. I will have much more to say about yearly pivot support and targets next week, but for now I'm aiming for YR1s to start and will stay bullish with USA indexes above all pivots.

Bottom line
Though markets have fooled me a bit in the past few weeks (markets dropping last week, sloppy exit on FXI short, and DXY weakness some surprise) the major decision to go from 120% long down to net 80% long on 12/12, and remain 50-70% long since then, has been very correct. I will use 2017 pivots to guide next decisions.

Pivots
Unfortunately 2017 pivots will not show on charts until new bars open.

Other technicals
If interested, please see review of yearly, quarterly and monthly charts on several indexes I track in previous blog posts.

Valuation and fundamentals
My interpretation is moderate positive for the market.

Sentiment
Sentiment extremes reached near 12/8 was part of the reason for reducing longs shortly after.

Timing
December dates (published 11/26)
12/1-2 strong - turned out key pullback low as suggested last week: "If Tech holds Q4P a lot would line up quite bullish" 
12/7-8 maybe turn - non event middle of up
12/19 - looks like mild high test +1 on 12/20 for DIA, QQQ, IWM
12/28 - QQQ and SMH high

January dates
1/4 (strong)
1/6-9
1/17-18
1/28


Positioning

Last week start of week:

3 IWM, 2 DIA
3 XLF, 1 SMH, 1 QQQ
= 10 longs or 100% long

2 IWM short hedges from 12/12, stop is daily bar close above YR2
1 FXI short from 12/12, planning to hold
= 3 hedges/shorts or -30%

Portfolio at 70% net long. 

Adjustments

12/27 no changes
12/28 take SMH gain
12/29 no changes
12/30 no changes

3 IWM, 2 DIA
3 XLF, 1 QQQ
9 longs or 90%

2 IWM short hedges
1 FXI short
3 hedges / shorts = -30%

60% net long, 10% cash. 

Long term charts - Global stock indexes

Choice of index is key. When I worked at a fund that was very active in Japan of course we were constantly looking at the Nikkei, Topix and $USDJPY. But in my own retail brokerage account I cannot so easily buy Nikkei; instead the choices are EWJ and the currency hedged DXJ. One should prioritize the index where your money is going, and be aware of others that may impact. 

Another example is India. The Nifty 50 Index is sitting on monthly 20MA support, but due to currency issues the INDA ETF is well under a sharply falling 20MA. If I want exposure to India is through the ETF, so I think better to look at that instead of the index. That said if a currency hedged version appeared then given under-performance of ETF relative to index then that would likely be a better alternative. 

The list goes on and on but you get the point. I'm going to keep to what I usually track because that is what I can buy: SHComp, FXI, EEM, INDA, RSX, EWZ, and the broad ACWI functions like an NYA / VTI. 

Sum: China looks like trouble, INDA the better choice for longs among FXI and EEM; RSX very strong but at resistance, and EWZ mixed. 

SHC Q
Ready to resume down. 

SHC M
Above rising 50MA, below falling 20MA. I would bet on lower. 

FXI Q
Below 10 and 20MAs with quarterly MACD on sell. 

FXI M
MA cluster pushed down and pivots broke - simple reasons for shorting. It worked.

EEM Q
Below MAs and on MACD sell. 

EEM M
Below falling MAs, but smaller red bar may have better chance at lift than FXI. 

INDA M
Small red bar and below MAs. Still proximity to recovering M50MA makes this better choice compared to FXI or EEM.

RSX Q
Rally to near 20MA. 

RSX M
At falling 50MA, a reason I thought better to cut. 

EWZ Q
Below falling 20MA but 2 closes above 10MA helps. 

EWZ M
Resistance near that falling 50MA. 

ACWI Q
Small up bar with wick invites selling. 

ACWI M
Also looks ready to drop. 

Long term charts - currencies & commodities

DXY sum: long term room to go higher, next monthly bar is either way. 

EUR sum: DXY in reverse - long term i think this is going below 1, near term maybe some short squeeze frustration.

BTCUSD sum: Wow! Partially confirms problems in China, but also replacing gold as 21st century alternative. 

If a pro fund there would a lot more to do in this regard but since I'm not really trading forex leaving it to these three. 

DXY Y
Room to go higher. 

DXY Q
I saw some comments about the 61% retrace on DXY from 2001 top but this Fib from 1985 seems very much in play with several direct hits on 50% level. This implies room to go up to 107. Some BB divergence but RSI still climbing looks fine. 

DXY M
Could see drop back inside band, we'll see. 

EURUSD Q
There may be a shuffle at recent lows but c'mon, below 1.00 remains the more likely move. 

EURUSD M
Short squeeze? 

BTCUSD M
Under 200 as recently as Jan 2015, and under 500 in Aug 2016. 

Oil - OK only one commodity. 

CL1 Q
Room to go higher. 
 

CL1 M
Also not bad. 

Long term charts - safe havens

TLT sum: Room to drop further. 

TNX sum: 3.0 area very doable. 

GLD sum: Looks terrible.

VIX sum: Lower end, but considering several spikes to upper monthly BB and above from 8/2015 to 1/2016, could stay lower before a big jump. 

TLT Q
Break of 10MA and 20MA may force more selling. 

TLT M
Below 50MA and weak bounce so could easily resume lower. 

TNX Y
This view of things is not that impressive. Still under a falling 10MA and two stabilization bars still well under the high of the last down bar, 3.03 in 2014 Q1. But the hammers do have a chance for follow through. 

TNX Q
Second time above 10 and 20MA since 2007. This has potential for significantly higher, with 20MA starting to slope up and first resistance currently above 3. 

TNX M
For now pause at M100MA and upper BB. Let's see reaction. Small up bar invites selling, but it would not take much to clear. 

GLD Y
Major league selling from a 1 year bounce - could easily resume downtrend and break 2015 lows. 

GLD Q
Ugh, below falling 10 and 20MAs. Avoid!

GLD M
Also below all MAs. 

VIX Q
Important study. Key points: #1, 1995-2000 screaming bull market came accompanied by rising VIX! This would throw my current systems off. Hopefully does not happen but have to be aware of the possibility. #2, Return back to falling environment in 2003 Q2. 2007 did correctly anticipate trouble that followed with 4 quarterly bars UP that year and a close above the 50MA! #3, quarterly reversal bar 2009 Q2 pretty good job of confirming stock buys, and again 2011 Q4. #4, 2016 January did not really scare VIX compared to other declines and have to say VIX turned out correct. VIX has not been below 10 since 2006.

VIX M
Note support at 2007 close lows (price low is the lower red line)

Long term charts - selected sectors

I will include yearly charts when price history is sufficient for commentary. 

IXM (Financial Index) sum: Impressive move underway, but a pause on the monthly chart would be not be surprising.

SMH sum: Quarterly chart fine, but monthly view inviting sellers. Back under 70.75 would add to bearish concern. 

XBI sum: Quarterly chart 61% correction of 6 year rally in just over 6 months. Monthly chart mixed signals. This may continue in wide range bound fashion for quite some time. 

XLE sum: Quarterly chart room to go higher, but monthly view suggests down as next move. 

IXM (S&P Financial Select Index) Q
Very impressive bar, currently pausing at 2000 price & close high area. 

IXM M
Quite a lot outside the BB. At point point time needs to catch up with price. 

SMH
Just above 61% level, so a fade back under 70.75 would look more threatening.

SMH Q
Very strong. 

SMH M
This view is inviting sellers. 

XBI Q

20161231 75 XBI Q.png

XBI M
Falling 20MA acting as resistance now countering the bullish hold of the rising 50MA. 

XLE
50% recovery.

XLE M
Falling BB and flat 50MA means down more likely near term move. 

Long term charts - USA main indexes

Unfortunately the the scripts on TradingView will not show 2017 pivots until the new bars open. But we can use this time to do a thorough check of long term charts. Here are comments on yearly, quarterly and monthly charts on a variety of key indexes.

SPX sum: Uptrend across the board, each timeframe above all rising MA lines. No noticeable RSI divergence. Y and Q charts overbought, but that is common in bull markets. RSI overbought on the M chart would be more toppy. 

NDX sum: Sideways since election and a textbook doji bar on the quarterly chart. Though technology did great under Obama (and Clinton) history may be set up to repeat here with tech leading lower in 2017 with the new administration. 

INDU sum: Very strong across the board. INDU M reaching overbought, so just watching to see how that reacts in January. 

RUT sum: Upper band levels on quarterly and monthly charts levels to observe at this point. After INDU, RUT is the next strongest index technically speaking. 

NYA / VTI sum: VTI looks like SPX. NYA more bearish with selling from 2015 high.

Strongest: INDU, then RUT. Weakest: NYA, then QQQ. SPX and VTI are overall uptrends but could be showing more limited upside with reactions from their upper monthly Bollinger bands. 

SPX Y
While some may think a yearly chart superfluous, the 2007 top was clear as day on this view. The market is still quite strong here, powering up outside the band. It is some high inside the band, or a drop back inside with the band acting as resistance like 2000 and 2001, that would mean trouble. 

SPX Q
All above rising MAs and launch above 10MA which has basically held as support. RSI closing at 74.7 is up there but I think stronger to be here than near 70 which would look like threatening divergence. 

SPX M
Tagging the upper band here and slight fade. The band will be higher as January opens. RSI is not overbought yet. 

NDX Y
This doesn't look bad but anything back under 4816 could become threatening. 

NDX Q
A textbook doji bar! Surely I won't be the only one to notice this and could bring out sellers early in 2017. 

NDX M
Still above that high but looks more like a struggle. Clear reaction down from upper band. 

INDU Y
Looks great. 

INDU Q
This kind of strength is not how markets usually top out. 

INDU M
Stronger than SPX outside the band and RSI at 70. I'll be watching to see how that reacts in the new quarter. 

RUT Y
Nothing wrong with this. 

RUT Q
Near tag of the band and RSI back up to 69.50 something to watch. 

RUT M
Outside the band a sign of strength. RSI not yet overbought. 

NYA Y
Inside the band with clear resistance 2 of last 3 years. 

NYA Q
Thus far a double top. Another interesting level to watch in 2017. 

NYA M
Clear institutional selling at the 2015 high. 

VTI Y
Not in existence long enough to have yearly bands. 

VTI Q
Looks pretty good. RSI near 74 slight but not threatening divergence. 

VTI M
Looks like SPX with fade back inside the band. 

Safe havens

Sum
As of 12/31, VIX is still below all pivots. This means "buying the dip" is usually the more correct approach. XIV which has done very well on turns in Q4 a bit more concern with 2nd rejection from Q4R2. 

TLT and GLD still look very weak and likely will open below long term pivots in 2017. 

Charts
Weekly with long term levels only
Daily with long term  medium term
Daily with pivots only (no support or resistance) and moving averages for entries

TLT
Weekly move for 2016 2H was drop through 2HP, then that level acting as resistance, then wham.
Daily chart high on Q3R1 exact.
Daily chart struggle to work off oversold and not much gain. This could easily drop back down. 

GLD
Limited bounce just barely back above YP.
Though above a pivot, falling MAs and no MACD / RSI advantage yet so not thinking entry long. 

GDX
If anything a short at 2 pivot levels acting as resistance and falling MAs. 

VIX
Study VIX weekly chart and consider for the year ahead.
Daily chart still under all pivots. 
MACD positive, but into falling MAs and below pivot resistance means more likely fade. 

XIV
Done very well on the turns this quarter! Low bang on YP 11/3-4; high bang on Q4R2.

USA main indexes

Prior week: "All USA mains still under major yearly resistance levels on cash indexes but no significant selling pressure yet."

Last week: Selling pressure from key resistance at SPY YR2 near tag, NDX YR1 bang on, INDU YR2 very near tag, RUT YR2 exact. 

Sum
Unfortunately the software doesn't show 2017 pivots until the next bar opens. So take the time especially to look at the cash weekly charts with key lows on yearly support, key recoveries and holds of YPs mid year, summer pullback from yearly resistance, election blastoff and move to next yearly resistance. 

Charts
Cash index weekly charts with long term levels only
Daily ETF chart with long term & medium term pivots
Futures current contract pivots only (no S/R) and MAs for clarity of entries (now March 17 H)
Futures "1" continuous contract with the works

SPX / SPY / ESH / ES1
SPX stopped just shy of YR2.
SPY (slightly different pivot structure due to 8/24/2015 spike low) 1 day above Q4R2 but this level essentially the high.
ESH already one test and hold of D20, this pullback breaking after more distribution and sideways from mid December.
ES1 like SPY shows top near Q4R2.
 

NDX / QQQ / NQH / NQ1
NDX high bang on YR1. 
QQQ (again different due to 8/24/2015 move) also on a level, 2HR1.
NQH dropping onto fallign MA lines, not best setup for short; but MACD about to roll over negative. 

INDU / DIA / YMH / YM1
INDU high 40 points from YR2. 
YM futures charts show first test of rising D20 since election day.

RUT / IWM / RJH / RJ1
RUT low of year on YS2 and high on YR2. Very pretty!
Hedged on IWM at the YR2 right move. 
This also could be a bullish working off of overbought conditions. 

NYA / VTI
Bad data tick on NYA. Unless that gets smoothed out pivots are not reliable for 2017. 
VTI high not on any long term level, but near enough to Q4R2. 

Valuation and fundamentals

According to Thompson Reuters, the SPX forward P/E ticked up to 17.30 while price dropped, a bearish development. But the 10MA of the implied earnings estimates given the SPX price level continues to increase, from 127+ to above 130 in the last 3 weeks. 

The last several weeks I have been mentioning 18x-20x forward earnings. I don't think this is too optimistic for the euphoria stage of a bull market, but I will pay attention to any consistent reaction from a round number level or and perhaps 17.5x.

Currently, 10MA of 17x forward earnings is 2221, up a bit from last week. 17.5x is 2286, and 18x is 2351. The 18x-20x target range is now a bit further away at +5% to +16.7% from current price levels. Of course, if earnings continue to increase then SPX could stay at 17.5x and gain in value over time. 

*

Citigroup Economic Surprise Index about sideways from last week. Still in positive territory. 

My interpretation of these is mild positive for markets. For now the 2220 area is an added possible valuation support level. 

Total market view

Review
12/17 Total market view: "Even though initial blast off post election lasted longer than I thought, I think likely that Santa has already delivered and next move sideways or some drop. Digestion would be quite normal here. At the same time, unless there is some political or international relations shock, it is hard to imagine too much selling pressure."

Results: Indexes were fractionally higher for the week for an overall mostly sideways move.

Sum
USA main indexes have rallied to yearly resistance on cash indexes and since then about sideways for 2 weeks. This lack of selling pressure increases the chances we will see a move back to those levels or above into year end. 

Bottom line
Portfolio is decently long and will return to fully long if IWM closes above its YR2 for minimal cost hedge. Plan for now is to hold the FXI short. I'd rather not return to leveraged long by chasing the market into a year end rally recently after sentiment extremes, but willing to return to 100% long on strength in this environment. 

Positioning
It is often good to have some buying power near beginnings of new quarters as definitive moves often begin. Current recommendations are:

100% long USA indexes (3 IWM, 2 DIA, 3 XLF, 1 SMH, 1 QQQ)
-30% hedges & shorts, via 2 IWM hedges and 1 FXI short
70% net long
(Positioning limits 150% long and 50% short or hedge.)

See this dedicated post for details and adjustments from the past week mentioned in Daily comments. (Note: This system does not include currency, bond or commodity positions.)

Pivots
USA main indexes - Cash indexes have run into yearly resistance on SPX, NDX, INDU and RUT, but for the last 2 weeks there has been no serious selling pressure. I think it is likely that INDU will tag 20000, but YR2 is just above at 20029. Multiple USA mains above these yearly levels would be very bullish, but I think sideways is the bit more likely move.

Safe havens - VIX confirmed long and strong stocks from 11/9. XIV a bit more sign of trading top last week. TLT and GLD below all pivots also bullish for risk assets.

Global - Hold FXI short? I think so. 

Currencies & commodities - $USD has faded a bit and EURUSD bounced off lows, but everyone knows EU is at risk and I think this will be reflected in currency in 2017 by a move below 1.00. Bitcoin, whoa! I took my eye off this (though was tracking earlier in the year). Oil doing OK here, with CL1 above Q4R1 and rising MAs which could give a pop to RSX.

Other technicals
Some monthly and weekly Bollinger bands now acting as resistance:
SPY fallen back inside M BB and entirely inside W BB last week (after 2 weeks outside).
QQQ has not joined the party and has been inside both M and W BBs entire post election rally.
DIA still well outside M BB, and still outside W BBS the last 3 weeks!
IWM outside monthly, but dropped back inside W BB the last 2 weeks. 

But all USA mains except QQQ holding nicely rising 10MA or 20MA since 11/9. 

Extended uptrends, but bullish technicals usually equals digestion. But hard to imagine not seeing a fling up to highs near year end or early January. 

Sentiment
Several extremes recently reached. This does not mean the market has to go straight to bearish extremes. 

Valuation and fundamentals
Moderate positive for market. Current valuation SPX targets 2350-2612 (admittedly wide). 

Timing
December dates (published 11/26)
12/1-2 strong - turned out key pullback low as suggested last week: "If Tech holds Q4P a lot would line up quite bullish" 
12/7-8 maybe turn - non event middle of up
12/19 - looks like mild high test +1 on 12/20 for DIA, QQQ, IWM
12/28 - TBD, but would make nice pullback low


On 2017 pivots and strategy into the new year

Big picture first - USA main indexes will open above 2017 yearly pivots. Safe havens TLT and GLD likely to open below yearly pivots. This is bullish for risk assets and points to YR1s (and possibly higher) for stock indexes and YS1s (and possibly lower) for safe havens. 

SPX YP 2116, YR1 2423
NDX YP 4597, YR1 5306
INDU YP 18456, YR1 21463
RUT YP 1235, YR1 1527

Also, due to the 2016 low in first half, the 2017 1H pivots will be decently higher than the YPs. For example SPX 1HP is on track to be 2207. This will also be the Q1P because the low for the 2nd half was also in Q4. This will be solid support. 1HR1 & Q1R1 will be 2332, a nice and very attainable target. 

Scenarios from here:

Most bullish - USA indexes jump above yearly 2016 levels, continue melt up without any touch of 2017 Q1 pivots (though JanP tests could provide buying chances). Strategy would be out of hedges, hold all long positions and look to add leverage back in. 

Bullish - USA indexes continue fade from current yearly resistance, test new JanPs and head off up. In this case current positioning is fine and we can just wait to cover remaining hedges and add longs. 

Mixed - A test of Q1P now at 2207 implies a 4.5% correction on SPX. This is about the same as the pre-election drop from August highs to November lows. Seems a bit much. But if this happens, we might want to be a bit less long. 

Bearish - Any sharp selling into year end or early January that changes basic pivot status of USA indexes above pivots and safe havens below. At this point seems unlikely. 

So what will it be? Will big institutions re-balance in the new year, thus giving a bounce to bonds and pullback for stocks? Or will promise of tax cuts and FOMC rate hikes lead to re-allocations supportive of risk assets? Will we see any rotations into what has been most beaten up? At this point, both India and China look terrible! Brazil and gold both looked terrible at the end of 2016 too. While I am aware of all these questions, my simple solution is The Pivotal Perspective. We are long the leaders above pivots, and avoid, hedge or short what is below pivots. But we are also very keen to watch the moves that start near the beginnings of new quarters, as there often is a pivot setup and a definitive new move

Positioning

Last week
3 IWM, 1 DIA
3 XLF, 1 SMH
1 RSX, 1 QQQ
= 10 units or 100% long

3 IWM short hedges from 12/12, breakeven stop
2 FXI shorts from 12/12 & 12/14
= 5 hedges / shorts = -50% short

Net long 50%, total exposure 150%. 

Adjustments per Daily comments
12/19 Take gains on RSX based on weekly chart
12/19 Take gains on 1 FXI
12/19 Changed stop on IWM hedge to daily close above YR2 (instead of breakeven)
12/20 Added DIA so that portfolio would be 100% long if hedges taken out
12/21 no change
12/22 covered 1 IWM hedge

Current
3 IWM, 2 DIA
3 XLF, 1 SMH, 1 QQQ
= 10 longs or 100% long

2 IWM short hedges from 12/12, stop is daily bar close above YR2
1 FXI short from 12/12, planning to hold
= 3 hedges/shorts or -30%

Portfolio at 70% net long. 

It often is a good idea to have some room to maneuver at beginnings of quarters as new definitive moves often begin.