Metals

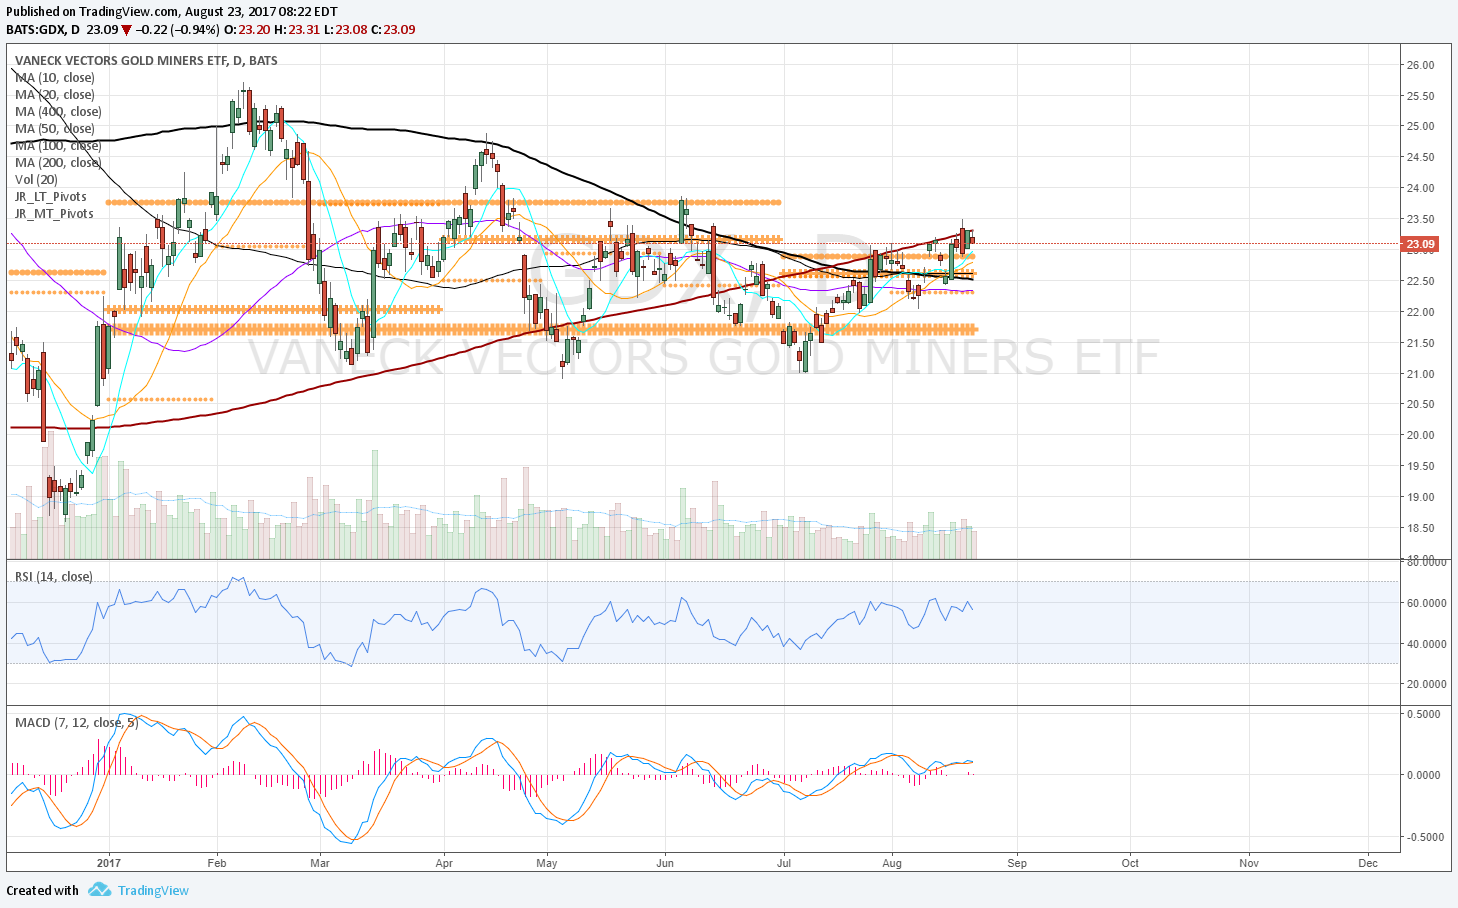
TPP gave a rec to buy GLD on 7/11 just after the YP hold, and I haven't seen any reason to sell yet. Here I'd like to point out that GDX has spent the last 5 trading days above its 2HP (ie above all pivots) which has been fairly rare this year. 

In addition, SLV (not something I always track) has recently lifted back above its YP and held yesterday. SLV is a bit weaker, still under 2HP and Q3P and a falling D200MA, but may join the others above all pivots. SLV looks interesting here, and although I don't like to fight a falling D200MA, there have been several days of selling from this level and no downward motion. This could squeeze higher. 

With DJT threatening shut-down, bonds are the less likely safe haven. Aside from sectors like utilities, institutions concerned about stock valuations can buy volatility, metals or raise cash should their funds allow that. 

GLD, GDX and SLV below.

23 3 GLD D.png
23 1 GDX D.png

GLD and GDX

There is a method to this... checking GLD and GDX after currency review. 

If you search the tags on gold you'll see TPP all over this move from mid January with the move above the 1HP on GLD, and further recommended adding units above the YP. But since then it has been choppy and I have been fooled by move above and below the YR1 / 1HR1 level. Ie, take profits on gains, add back, take again. The last weekly post recommended a position reduction if we saw selling from YR1 (ie inability to maintain gains on 3/29) which we did. 

The last weekly bar on GLD suggests drop to me, ie, small blue bar under major resistance. But reclaiming the YR1 would be bullish. Really we only see 1 buying (ie up) bar above that level otherwise red. If you bought down 1/25 week that is still an OK long term hold, but the buys the next week are the question here. 

GLD D as of yesterday looked like it may try again to clear YR1 but today dropping back down again. This will be the first month since December that GLD is below its monthly pivot. I think more likely move is down to Q2P first near 114. 

GDX also just under YR1 / 1HR1 combo.

But doing better on its AprP so far. These are obviously correlated but they don't have to move together all the time. Last year there was a big drop in GDX while GLD barely moved. Still, due to volatility of GDX, it is better to have GLD on your side for direction.

GLD and GDX

Like the currency charts today I will do long term levels, then quarterly and monthly charts. 

GLD W chart fading back under YR1 again. This would be very negative for a full GLD/GDX position. We are still 3 trading days from close but concerned about re-balancing / profit taking in the new Q. Anything close below the YR1 level again would be a reduce. 

Here's the daily chart with the same long term levels. We do not want to see the YR1 act as resistance today after jumping above yesterday. But above is OK to hold.

Note: current GCJ contract YR1 level is 1230, so that can be factored into this decision too.

GLD Q chart still in downtrend really, below a falling 20MA. 

But M chart turning above a flat-ish 20MA. After one fake-out bar 2015 Jan, this is the best move in years simply going by this measure of above / below the monthly 20MA. 

GDX below the YR1 but willing to give room if GLD / GCJ holds. 

GDX Q chart also still in severe downtrend but the small red bar 2015 Q4 (ie no more selling) was part of the tell for the bounce here. Also helps to be back above the 2008 low.

Above a still falling 20MA that should be in process of flattening out. First time in years above the M 20MA though. 

GLD and GDX

These got whacked today. Too bad, I thought stocks may consolidate this week but didn't think that would correspond with a big drop in GLD. FOMC chatter. Anyway, yesterday GLD was comfortably above YR1 and today gapped under the level. If you had full positions then the decision here is to reduce taking gain today or use the MarP as a rough stop area and see what happens.

The other thing to factor in is the DXY yearly pivot; see the recent currency post. Point being DXY above YP would be additional pressure on GLD and GDX.

GLD W chart 1 week up bar above levels, 2 weeks red bars, this one looking like break although 2.5 more trading days left before close. 

And there is the MarP smaller orange dots which still can be support. 

GDX W looked like it might clear the YR1, but fading under this week. 

GDX yesterday looked fine above YR1, today down but not so bad. Well above the MarP. 

GLD and GDX

Search on GLD tag or look through featured posts and you'll see I started sounding quite bullish on gold in late January, and even suggested an add if it traded above its YP (which happened in early Feb). In the last weekly strategy sum, I mentioned to keep an eye on the YR1s. Of course GDX is an extra juicy way to play gold although the correlations don't always line up exactly. 

Now, whether this is the start of another epic run like the 2000s into 2011 remains to be seen. If you got in early then easier to give those positions some room. Gains on the adds in early February are what are at stake, if still holding those. 

GLD and GDX have held up quite well despite a big stock rally, so if stocks fail at big yearly levels (TBD) then perhaps they will get another run.

Sum
I don't have a firm conclusion at this point. GLD exceeded its YR1 and just now dropping below. GDX has had 2 days of high volume selling exactly from its YR1, but so far holding up fairly well. But both remain above all pivots and have nice upward sloping D20 and D50 MAs. If GLD stays above its YR1 then it is a much easier long term hold. Even though GDX has had selling from that level, if GLD stays firm then that should help GDX as well and then I would think to hold above all pivots. 

GLD W would be better to hold the YR1 as support, but right now breaking, somewhat bearish especially on weekly close. Of course all could change after 2:00 today, but this is what it looks like now. 

Here's the daily chart so that still quite healthy above all pivots; GLD did far better than TLT maintaining gains through the stock rebound. You could make a case for holding above the monthly pivot and if that lasts, then seeing how the Q2 and AprPs look.

And here's the daily chart with all levels. You can see the attempt to jump above the YR1 has faded and now maybe turning into resistance. Keep in mind that virtually all asset classes had major turns on yearly levels already. 

Here's a standard daily chart chart with simple moving averages (10, 20, 50, 200) and Bollinger bands. RSI is about in buy area near 50 and there is both lower BB and then eventually the D50 can be support soon. So I am not saying sell here; just watching what happens at the YR1s and then deciding whether best to reduce position or hold. 

GDX was structurally weaker so far has stopped right on its YR1 / 1HR1 combo. That said, maintaining most gains so far. 

Daily view with all levels. Large high volume selling bar at the YR1 / 1HR1 combo on 3/8 and again on 3/14. That said, still above all pivots. This is why it is often a good tactic to take some profits on a big level, and hold other positions as long as it remains above all pivots and/or above rising MAs lines. 

Again on this view GDX just doesn't look too bad yet, only 1 slight close below a D20MA.

Bull vs Bear

On 1/7/2016 I wrote: "Is this a key low or is the bear for real? Bear for real below the 2016 YP at 4373." This was a simple statement but actually quite carefully considered as explained here.

Now some might say that didn't turn out, because SPX and INDU were down only -15% from 2015 high to 2016 low, and NDX about -18%. If you are using -20% then OK that didn't qualify. Although the weaker USA main indexes RTY and NYA did reach bear territory with -25% and -20% respectively. 

Also consider by shifting conclusively bearish I emphasized the safe haven trades from there: TLT, GLD and perhaps some GDX. After 1/7, these had the chance for 11% upside in TLT, 19% upside in GLD, and 68% in GDX! Now you wouldn't have gotten these exactly because it is measuring a low made after 1/7 to the highs; but similarly, the stock indexes measure the drop from high to low. 

Meanwhile after 1/6-7, SPX had about additional -9% down to the lows, INDU about same at -8.5%, and NDX a bigger drop after 1/7 (because that is when YP broke) at another -10% down.  The more bearish vehicles as noted above were another -12% down on RTY and another -9.5% on NYA.

So despite SPX, NDX and INDU not reaching that 20% media headline number, this idea of playing the market more defensively worked quite well. Until 2/12 when oil bottomed on its YS1, INDU recovered its YS1 after a slight break (DIA and YM held) and RTY held YS2! I did recommend speculative buys on INDU and oil right on 2/12

Since then I have recommended even more longs, but still wary of the rally with two quick short shuffles that were nixed the next day. Why? Because stock indexes were below 3 / 4 pivots and only recovered monthly levels, while still below yearly, half-year and quarterly pivots!

But now it may be time to shift tune. INDU / DIA / YM has been the pivot leader on the rally. This wasn't the case in the 2009-2015 bull market where it was the NDX. What I mean by this is SPX, NDX, and NYA all broke their YS1s, and RTY went all the way down to its YS2, but INDU broke YS1 fractionally as DIA & YM clearly held.

INDU was the first cash index to close above its FebP (fractionally on 2/17) with others still below, and likewise the first to close above a long term pivot on 3/4 above its 1HP, where the others hadn't done that yet. And really YM and DIA were the best tells last week, clearly holding major support before the big jump at the end of the week. On Friday both SPX and INDU leaped above all pivots on Friday, but with INDU the current leader the market call here is:

Bull alive and kicking above 17138 (the highest of the INDU pivots, the Q1P) and still more likely than bear with INDU above its YP at 17048.

TLT and GLD update

The Pivotal Perspective has been all over the safe haven rallies because it was crystal clear using this method that both were making positive moves from important levels as stocks rolled over. Summary posts are here for TLT and here for GLD

Although I did say taking some gains from the more recent adds (TLT adds 1/25-28, then GLD adds 2/4-5) I encouraged to put them back on per bearish playbook. So we are in management phase of full positions on these. Now what?

TLT weekly chart with long term levels shows clear lift above 1HP, clear big high volume jumpabove YP, which acted as support from there; pause at 1HR1, tag of 1HR2 / YR1 area but maintaining pretty well. So the big issue is whether that's it for the year or if TLT will clear the YR1 and go for the 2015 highs or maybe higher. A simple long term strategy could be to hold above the 1HR1 near 128 that can act as support.

I don't like to see 2 smaller blue bars in an uptrend especially with wicks, but let's see how the bar closes and how stock indexes react to their FebPs from here. 

Here's the daily chart with medium term levels. You can see the launch above the QP and JanP, then Q1R1 turned into support, Q1R2 turned into support, but still struggling at Q1R3. OK, maybe Q1R2 will continue to hold as support. Also, in a few trading days, we'll have the March pivot which will probably act as support. Per my bias I think this is a full hold but it will be much easier if stocks indexes reject their FebPs. 

GLD was making an equally clear move a few weeks behind TLT. GLD did try to jump above HP & YP in 2015, but the difference at the time was that stock indexes were still above their YPs while this time they had crumbled. Knowing that is why I was really thinking the move was for real, in addition to seeing DXY weakness at the time. 

GLD too has quickly reached its YR1 / 1HR1 combo. So again we have the same issue - is that it for the year? Or will those levels clear and hold as support? So far just a pause, no red and looking like it could clear - and would be an easy hold for higher targets. 

Here's GLD D with medium term levels. Similar jump above Q1P, and was already above JanP at the time. No damage from Q1R1, a jump above that. Now it is consolidating under Q1R2 but not too much damage. 1 day rejection met with buying today. So I also think this is full hold and let's use March levels to held guide the position as well as keeping an eye on the big YR1 / 1HR1 combo. 

If you added GDX for kick above its YP, that is doing fine and looks like it should test its YR1 / 1HR1 combo as well with even a Q1R3 nearby all 20.20 to 20.42.

4:25 EST update.

A much different look at the close on each. TLT small blue bar with rejection from a monthly resistance level.

GLD especially poked above but did not close above YR1, potentially bearish if any lower tomorrow.

Weekly strategy update

Judgment based on the close, but for now:

ES needs to hold 1925 its FebP. Anything below that would be first warning sign of trouble.

Also, yesterday I mentioned that it would be better for VIX to confirm strength by dropping under its QP of 19.27. So far that hasn't happened. 

The point on both of these is that a bearish move back under SPY / ES FebPs, along with INDU / VTI would mean cut recent longs and add shorts. List of short possibilities means anything that stayed completely under its FebP without even tagging: QQQ IWM IBB XLF and possibly NKY / EWJ or DAX / EWG.

GLD - I may have erred on the partial take yesterday. To be clear, I pointed out gold in late January and that main portion I think is worth holding, but any adds after the YP clear on 2/3-4 were the judgment call. Above its WP 116.97 would be short term bullish; then if GLD clears its YR1 again then I think worth having a full position. To watch. I haven't talked much about GDX, mostly but not exactly correlated, then I mentioned yesterday that it was doing fine. 

RSX, EWZ, EEM. These are fading a bit today along with the market, oil and $USD strength. EWZ in particular tagged FebR1 and now back under. As I type ACWI is dropping back under its FebP, so a close under that level would help point to taking some gains off the table on these quick squeeze ideas. EEM more tied to China and it hasn't done too much. 

BTCUSD is pulling back from its FebR1. It would be better above, but if markets start to slide again, or trouble in China, then maybe BTCUSD will explode higher. Buy on 2/16 near 407 just cannot become a huge loss so i think worth giving it room.


"1/20-22 Turn but not a buy call" looking good!

OK, the title sounds like horn-tooting and maybe so a little bit. But the main point of this post is to understand why i was making those calls 1/20-22 and what has played out since then, both in terms of money and aggravation saved and then perhaps more important, other opportunities. 

First, on 1/20 blog post "Big turn?" indicated possibility of decent turn and what we needed to see. 

1/22 post continued to point out all the yearly levels that had just held, along with oil. 

At the very same time, I was saying not a big buy on 1/21. 

Then clarified this seemingly contradictory view with a detailed post here on 1/22, "A turn but not a  big buy." 

Now, if you have a 1 week time-frame that is really short term swing trading which I am not addressing so much here. For that you'd want to be using daily, weekly, and some monthly pivots - and yes, the week of 1/25 SPY held its weekly pivot for the first time since the last week in 2015, so that was a decent buy for that kind of trading. But for those with longer term horizons, any buys 1/20-22 would likely be now under water. 

But that wouldn't be the only cost! In fact, maybe you could take some small stop outs and it wouldn't be a big deal. If you are trying to catch bounces, the big S levels are where to do it. Although I think a better method is to swing trade the bounces when you get a good setup on the shorter term pivots (daily & weekly, sometimes monthly) and hold core positions aligned with longer term pivots (yearly, half-year, some quarterly). 

The main point of this post is to point out what you would have missed if you focused on trying to catch the bounce in stocks - which at this point, is counter-trend move according to The Pivotal Perspective. 

The charts below show why I focus on buying what is above pivots, and avoiding, shorting or hedging what is below pivots. If you focus on trying to buy support (S) levels, ie, what is below pivots, once in a while you pick a nice turn but you could just as easily have a year of headache. Stock indexes are below major pivots for the first time in years, as safe havens jump above. This situation may take several months to resolve, or longer! 

Now for longer term short positions, yes, those yearly level holds were good places to take some profits or hedge a bounce. This is equivalent to taking some profits on big R (resistance) levels in an uptrend. That said, just tagging those levels is not an automatic all out - not by a long shot. Often you want to continue to hold some shorts if the index continues to trade below all pivots. I'll address this in a separate blog post soon and point out some examples. 

So by trying to buy the stock bounce you missed entries that we might not see again on TLT, GLD and GDX all below. 

1. You missed a chance to add TLT longs as TLT held its YP as support 1/20-28. Showing long term pivots only here.

2. You missed a chance to buy GLD as it cleared its 1HP for the second time this year on 1/25, and possibly adding above the YP on 2/4-5. 

Even GDX got in gear with long term buys last week, first above 1HP on 2/3 then clearing YP on 2/5.