Sum
Last week I pointed out all the major levels that all 5 USA mains were testing. With exception of NDX/QQQ, all 5 are under these levels. There wasn't a rejection, but so far the momentum has slowed.
SPX/SPY testing Q4R1s 2556; if higher YR2 2576 not far.
NDX/QQQ lifting above 2HR1 6068 slightly; may tag its Q4R1
INDU/DIA testing YR2 22937!
RUT/IWM fading a bit from YR1 1518 near test.
NYA & VTI both tagged Q4R1s and had mild reaction lower from there.
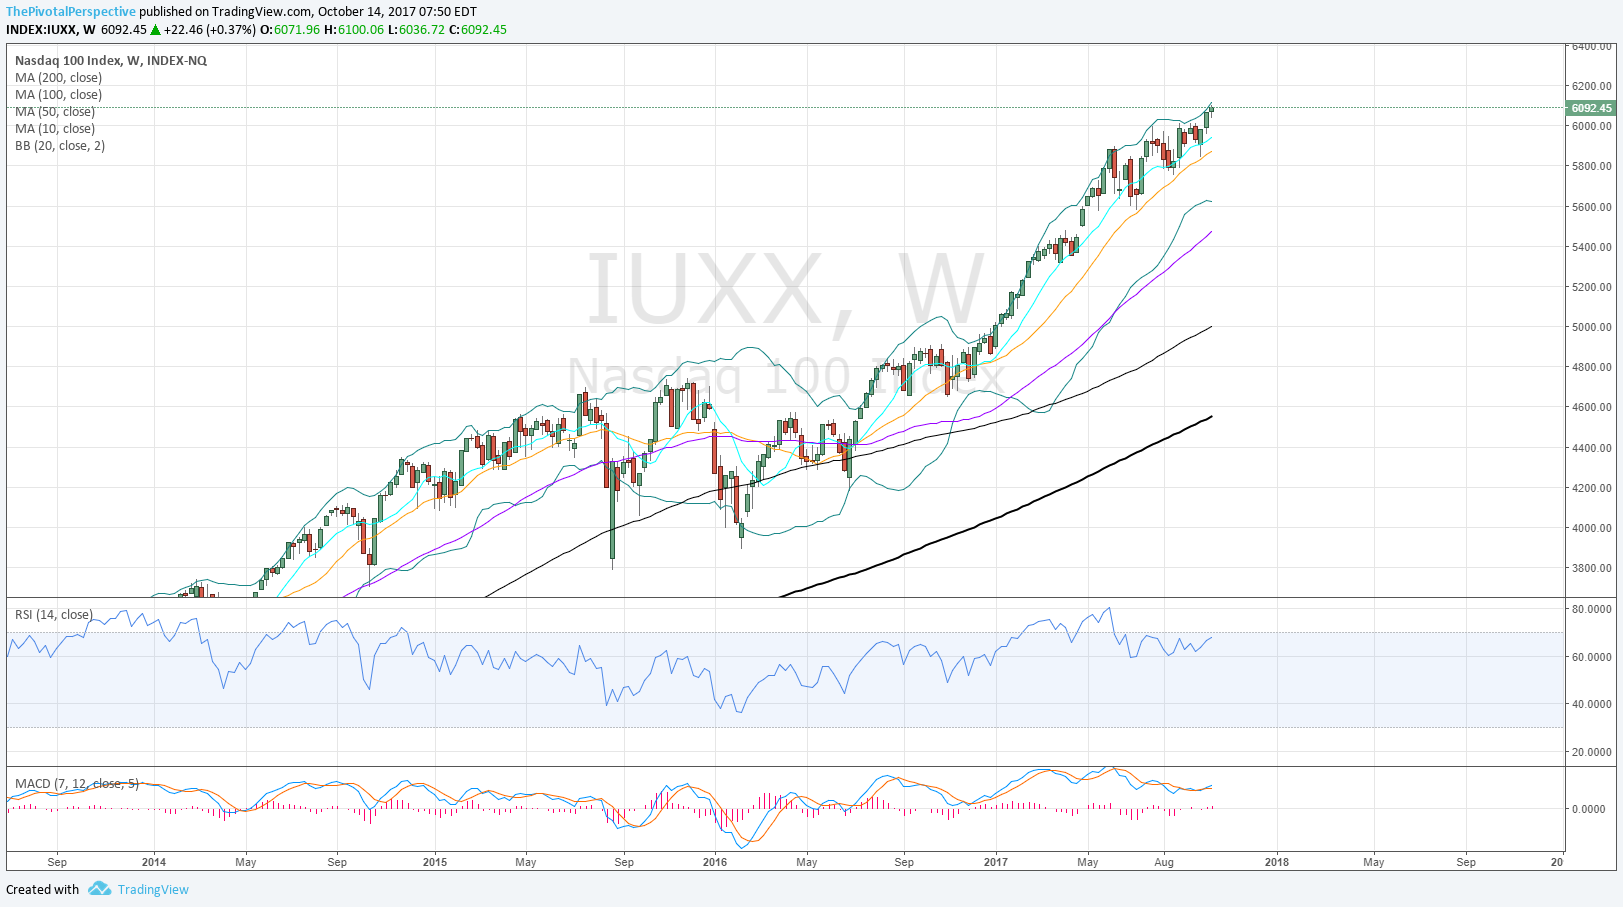
RSIs across timeframes (Q M W and D) are above 70 with exception of NDX/QQQ on weekly and daily charts. While this is a sign of strength to set up a divergence high later, near term increases the risk of a fade.
Even if the market can go higher into this week and INDU clears its YR2, then markets will be running into SPX YR2 and RUT back at it YR1.
SPX / SPY / ES
SPX W: Doji bar outside BB with RSI near 75 invites selling.
SPX W: Probably we will see YR2 2576 by year end.
SPY D: Testing Q4R1; OctR2 just above.
ES Z D: Back above all pivots and MAs on 8/30; and from there above all pivots since, with just 2 days below 10MA.
ES 1 D: Smart $ pivot traders bought AugS1 at 2422; probably some taking profits up here 2555 or maybe some holding out for 2573.
SPX sum: We will probably see YR2 2576 by year end, but currently at Q4R1 with RSIs overbought across timeframes and outside weekly BB means fade is more likely next move.
NDX / QQQ / NQ
NDX W: Inside BB and RSI not yet at 70 like other indexes - room to go up.
NDX W: Bullish to be poking above 2HR1.
QQQ: Also lifting above 2HR1, and may reach next level up at Q4R1.
NQZ: Recently back on buy 9/27-29 after failing 9/25.
NDX sum: Bullish to be lifting above 2HR1; RSIs not quite overbought and may have more room to go up than the others.
INDU / DIA
INDU W: 2 closes outside the BB is rare; RSI quite high.
INDU W: Testing YR2!
DIA D: Almost YR2 tag.
INDU Sum: Strong but just 32 points from reaching YR2. I think some near term reaction lower is the more likely move.
RUT / IWM
RUT W: Bit of a fade.
RUT W: Looks more significant from the Pivotal Perspective; dropping from YR1.
IWM D: Huge rally in Sept, but no follow through up in Q4 so far. Still above 2HR2 as support though.
RUT sum: Some pause after near YR1 tag but given structure not enough to say rejection yet. Still, this may turn into first choice for USA equity short hedges again (like much of the year until August lows).
NYA & VTI
NYA W: Bullish to be above 2HR2, but still need to watch that level to see if it holds.
NYA D: High on Q4R1.
VTI W: Between long term levels.
NYA D: Also on Q4R1.
Sum: Both have highs on Q4R1s with some minor selling so far.


