Oil

Well I am just happening to notice a few things here...

CL1 continuous contract quarterly chart at falling 20MA resistance

16 30 CL1 Q.png

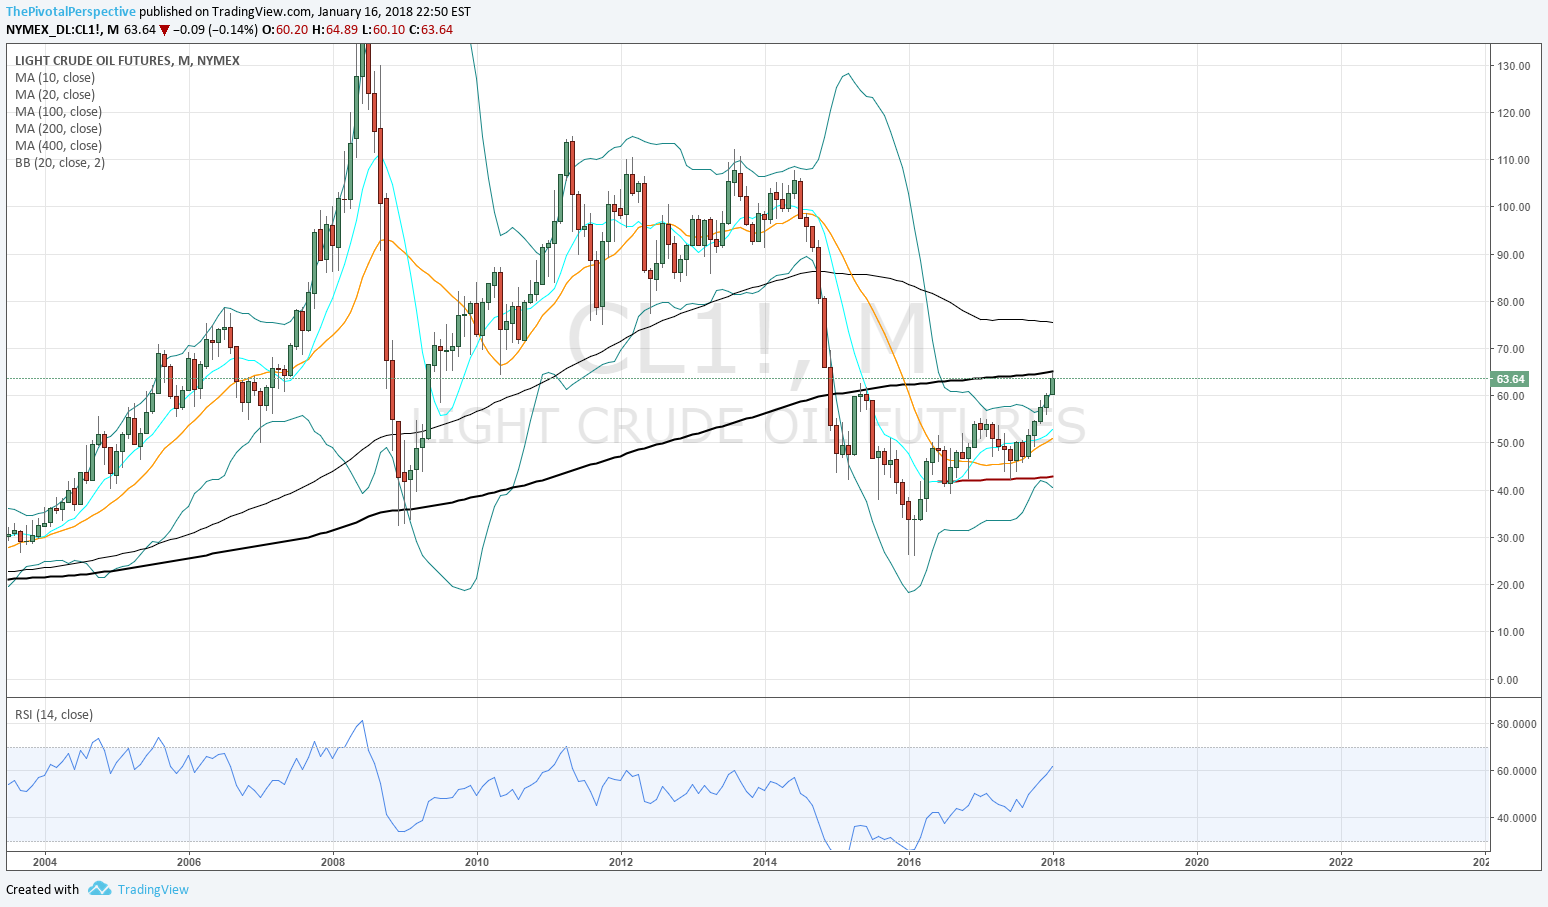
CL1 M
On 200MA.

16 31 CL1 M.png

CL1 W
Highest weekly RSI this decade. Last seen with oil above 100.

Cl1 D
Near enough to YR1 / 1HR1 combo; Q1R1 rejection seems about to happen.

RSX
Maybe this is the best vehicle with YR1 and 1HR1 rejections on same day.

Oil

I used to do a weekly post on oil and caught the low here. I am showing the original post right on 2/12 to prove that this wasn't just a hindsight fantasy. No rewind on data chart feed!

Oil had another 2 month rally from early April lows to 6/8-9 highs. After a choppy rest of June, July has been down hard. To my surprise, 2HP didn't even try to bounce. 

If oil keeps dropping then stocks more likely to fade, and safe havens resume rally. Oil related vehicles like EWZ and RSX that have put in massive rallies this year should drop, as well as XLE. But if oil rebounds then USA stocks likely continue higher, safe havens maybe more in range, oil related obviously supported too. 

For oil we can look at the current contract, but with the rollover I think CL1 continuous is really the definitive chart. We can also look at the ETF USO if we wanted to be thorough. 

CL1
Weekly chart with long term levels here. The low was basically a slightly lower low / re-test on YS1 / 1HS1 combo. It rallied to YP / 1HP and after some shuffle went all the way - almost! - to 1HR1. Then fell back to support. YP has broken but I thought the 2HP would at least try to bounce somewhat but instead has caved barring a big rally today which seems unlikely. 

Here's the daily chart view with medium term level pivots added. The high was on Q2R1 exact and the YP tried to bounce several times, but look at all those small blue bars (weak buying) before the breakdown. 

Daily RSI is the lowest since February and as it turns out DL1 is bang on its daily 200MA here. This is a bad setup for a short, which is just late no matter how you slice it. In fact, the risk-reward here is to play for a bounce, but why waste time trying to buy something below all pivots? Focusing on buying what is above all pivots, as usual, has been the best strategy. 

Oil

As everyone knows the market has been very correlated with oil this year. So let's take a detailed look.

Sum
Pivots caught the turns, with 2015 low on YS1, January low on 1HS1 and February low on YS1. On an even longer term view the CL1 contract dipped below, but did not close below the 2008 low (on a monthly basis). All this is very constructive for a possible long term low.  However, the weekly RSI and daily chart retracement are both at levels that often pause a rally. The pivots in play through the rest of the month are MarR1 which should hold as support. This is 36.79 for CL1 and 37.04 for CLJ. In addition, after being above its WP for 4 straight weeks it is trading below as I type (37.87). So, below 37.87 shows short term weakness, but medium term strength above 37.04. Below 37.04 would risk a larger drop and thus increase the chance of a more significant fade for stocks back under long term pivots. Back above 37.87 would be stronger and invite a near term move to about 40. 

* * *

CL1 W chart below and yes, the first low on 1HS1 near exact and the low of the year near YS1 also near exact. After plunging through support in 2014 without any attempt to bounce, there was a minor bounce on 2015 YS1 and now again decent rally from major support. But it will take a lot more to recover long term pivots. There is decent RSI divergence on the lows with RSI clearly higher and finally above 30 on the February low compared to 27 in January.


And here's the daily chart with all levels.You can see the one day break and recovery of YS1 on 2/11-12, with clear look of support after a selling volume climax. It jumped up to FebP and after some shuffle cleared on the last day (like many stock indexes). It has been entirely above the MarP and cleared R1. 

Here's the current J contract, W chart. 

And the D. Stronger to hold MarR1 as support.

Now on to some more typical view charts (MAs and BBs), again on the CL1 version. MA lines are 10 in blue, 20 in orange, 50 in purple and 200 in black. The first quarterly chart shows dip below 2008 lows and recovery above. Simply stated above the 2008 low of 33.20 is bullish.

Two closes on the 2008 low (ie above, not below) was the tell for the rally. RSI some divergence and quite a lot of BB divergence, but we may need another low at some point and the 20MA is still sharply falling. 

Classic BB and RSI divergence on the lows along with YS1 was why I said short cover or buy on 2/12 (only such call this year!). RSI high at 50 and downward sloping W20MA are both negative considerations. Red line is the 2008 low which now lines up with the 10MA. 

Daily chart nearly fully OB, 50% bounce from last October high to low.