2019 Forecasting Streak - 7 Weeks in a Row!

Last year I hit some home run forecasts that called for dramatic changes in trend before they happened.

But these don’t happen every week, and so also beneficial to be able to consistently hit singles and doubles. Recently I’ve developed the ability to research and engage with proprietary timing models more efficiently, and the result has been a pretty awesome streak of having the weekly view about right. Not everything is perfect but who else is doing this? I reached 7 weeks in a row “mostly right” before having a week while not bad didn’t meet my standards for this purpose.

3/11/2019 Week - Tech Leading Rally
Tweets 3/9/2019
”However, NDX is within a few points of reclaiming its MP and so above all pivots. It is usually not wise to be too bearish if NDX is above all pivots - something to watch in week ahead.
After 2 month rally my most preferred scenario is a consolidation month with next week up then back down after.”
NDX jumped above its MP the next day and off to the races from there.

4 4.png

3/18/2019 Week - Risk Off, Volatility & Bonds Up
Tweets 3/16/2019
”Per other timing work, my bias bearish / risk off for next week, and expect vol to get moving along with TLT and maybe GLD again.”
TLT jumped, volatility spiked, and DJI down (no chart on DJI)

4 6.png

3/25/2019 Week - Stocks Lower Then Bounce
3/24/2019 Tweet
”Given short term charts near oversold, current condition new high new lows, recent outperform in tech and growth, think lower than bounce attempt more likely.”
SPX mildly lower then up.

4 7.png

4/1/2019 Week - Global Stock & Small Cap Rally, Bonds Down
3/30/2019 Tweet
”Preferred scenario global indexes higher, maybe small caps get in gear - will be key tell if RUT can join others above MP. If any weakness would prefer to see in bond (overstretched) and maybe oil & energy.”
All check, only miss oil.

4/8/2019 Week - Stocks Higher
4/6/2019 Tweet
”Timing supportive for upside in coming week. Maybe NDX / SPX will be able to tag 2018 highs.”
Stocks higher, and NDX almost but not quite to 2018 highs.

4/15/2019 Week - Premium Drain
4/13/2019 Tweet
”With April option expiration this should be a drag on further gains. … Oh I think 2018 highs will test soon. But next week ideal for premium drain.”
SPX finished 2 points under the previous week’s close.

4/22/2019 Week - NDX Higher High & SPX 2930-45 Near 4/24
4/20/2019 Tweet
”Simply stated would like to see NDX make decent new high (closing basis) as SPX tests 2930-2945, ideally 4/24 area.”
Ding!

2018 Tweets

A collection of some of my best, with charts to show how timely these were. It is one thing to spot a trend change after it shows on the chart. It is another matter to accurately predict massive changes in market behavior within a specific period and be exactly correct. Tweets with dates link to the original tweets.

1. Volatility spike

“Special timing post: volatility cycles picking up 1/25-2/2 maybe through 2/15.”
Tweet 1/24

2. Tech drop

“Oct after that risk off… Sector at risk for Oct drop - surprise - tech.”
Tweet 9/20

3. Major risk off event

“Despite resiliency of main indexes $DJI $NDX and calmness of $VIX, my timing work says market has about 1 more week before a major risk off event likely for the rest of October.”
Tweet 10/3

4. TNX (10 year yield) turn

“$TYX $TNX both near YR2s with plenty of media on a key timing date - stage set for decent reversal lower (yes lower) from here.”
Tweet 10/5

5. December weak

Although not initially bearish for December from the start of Q4, some of my timing work is fractal in nature. Per end of November had shifted more bearish for December.

““Timing… 12/2-12 looks more at risk.”
Tweet 11/24

5 Dec risk.png

6. Markets bearish, cash recommendation

“Full on bearish week for indexes… Price action reminiscent of early 2016... which means we could see YPs test on DJI SPX NDX... Nothing wrong with cash here!"
Tweet 12/7 with DJI at 24388, YP tested 12/20 at 23091.

6 YP test.png

But not a perma-bear calling for EEM strength in Q4! This is addition to being bullish USA indexes for much of 2018, as shown throughout posts on this site.

“Timing in strong favor [for EEM] soon for rest of Q4.”
Tweet 11/1

Chart is EEM / SPY, now +6.5% up from that call for EEM strength. Other emerging markets such as INDA have much more gains as measured against SPY.

A concise 3 year review of TPP

This is a summary of the key highlights from 3 years of daily market comments and weekly reviews on this site.

If you want a more extensive version, please see the featured posts item on the menu bar.

2015
Recognized the low 9/30/2015


2016
Shifted completely defensive 1/7/2016, declaring bear for real

Then starting buying back stocks one day off the major low of 2/11/2016

And oil from 2/12/2016

And EWZ & RSX shortly after (massive years for both from there)

March 2016 turned back to full bullish mode on stocks

Recognized semiconductors in early stage of massive parabolic move

Called the all time bond top & yield low at the decade turn, one shot

Long and strong in August 2016 despite skepticism by big names on the street

Long financials before the election jump

Massively bullish after election

2017
Called for China tech to be leader for 2017 in Dec 2016 (3rd best category of 2017 after cryptos and short volatility)

Bought the dip in April after showing mild caution before

Remained bullish after August mini pullback

2018
Year started strong as expected

While noting that the asset class to avoid was bonds from mid January

Then nailed the stock top and volatility spike with VIX spiking as called in advance!
Twitter timestamp on volatilty call to spike 1/25-2/15 made on 1/24

Bought the 2/9/2018 low

Expected commodities to outperform in 2018

Noted emerging market weakness from April and beyond (one of many examples)

Bullish from early May

Caught the bond low and main rally of the year

And then nailed the October stock drop in advance with call of larger cycle weakness from 10/10 which played out exactly as called!
Twitter timestamp #1 calling for October down with tech most at risk for drop on 9/20
Twitter timestamp #2 on October 10/10 risk off from late Sept
Twitter timestamp #3 on next move -5% down on day of DJI high
Twitter timestamp #4 on immanent breakdown to happen 10/19-26 made on 10/22

PS: Bitcoin rec 406

As impressive as this list is, there are many many more good calls on the featured posts. I didn’t pick out the medium term trading tops and lows, currency moves, etc.

Throughout these years I have stayed mentally flexible and committed to my process and system. As it turns out I have spotted the many of the major moves in markets each of these years, despite their vary varying nature:

Turned bullish stocks and oil from 2/12/2016, including focus on oil, EWZ & RSX
Recognized semi-conductors in early stage of massive move up
Spotted the bond turn
Long financials before election jump, and bullish from there in general
These were most of the biggest moves in 2016.

Stayed bullish 2017
China tech was the 3rd best trade of 2017, after crypto and short vol (bitcoin rec from 406 kind of takes care of #1). Yes emerging markets were hot but it was China tech that was the leader of this theme.

In 2018, nailed both the Jan-Feb volatility spike (Twitter timestamped!)
and the October drop (Twitter timestamped!)
Among the two biggest moves in the shortest time of the year, while being largely bullish from the beginning of 2018, especially May and then July.

Is there any other analyst that compares?

I would love to pursue my passion full time at a fund or wealth management company. I have made all of these calls on a very part time basis while maintaining a busy day job, combining my system of technicals and timing. How is this possible? Because I performed many years of research for many years on what really moves the market in a way that is truly unique.

If you want to dig into the details and perform due diligence, 3 years of daily comments are on this very site. Recently I have shifted to 100% Twitter for more interaction. Thanks for your interest in my work, and I hope to be able to be in a position to do this full time in a role of more consequence in the near future. Thank you.

October 2018 drop predicted in advance

These calls were all timestamped on Twitter.

Larger cycle weakness from 10/10+ as called 9/23/2018
“Timing model Oct turn dates:
10/1
10/5 - risk on
10/13 - risk off
10/26

In addition, larger cycle weakness after 10/10-11 into end Oct or early Nov.”

Next -5% down move called on day of DJI high 10/3/2018
”Despite resiliency of main indexes $DJI $NDX and calmness of $VIX, my timing work says market has about 1 more week before a major risk off event likely for the rest of October. I won't press until everything lines up but just want to be clear on my view. Next 5% move is down.

D200MA breakdown call repeated 10/22/2018
"Despite RSI divergences and VIX suggesting stock bounce keeping to timing call of breakdown 10/19-26. SPX has complied but so far NDX and DJI have not - maybe in globex tho. Seeing a lot of people thinking to buy dip - market is in punish mode. Patience key.”

Then spotted the low chance on 10/29
”Probably I shd be more bearish but timing work says 76% Fibs maybe important. Still open to low idea. Also ES 30 min YP hold 2x.”

SPX 2830 target from 7/8

OK, this wasn't a huge move. But I was confident it would happen and it did. All comments from 7/5-7/8 were loaded with long ideas. As it turned out SPX exceeded the target by 2 days since then the 2830 has returned as resistance. 

7/8/2018 Total market view: "But right now I have to be pretty bullish here and simply thinking the since SPX just held major support it is likely heading to major resistance, and that level is 2830. If that happens then leaders can make new highs so that means IWM above YR2, and QQQ could potentially see QR1 HR1 YR2 cluster 181-184."

Result SPX high 2848, QQQ high 182.93, but IWM did not see above YR2.

INDA rec from 7/8

7/8/2018 Total market view: "A lot of global ETFs were beat up in Q2 as currencies slid and trade war impacted negatively. INDA has recovered back above its YP and closed fractionally above its MP as well; this could benefit from additional deep pocket buying and/or DXY slide."

This has been the first long side comment in any global ETF in months, as The Pivotal Perspective was clearly bearish global names from the start of Q2 with all 8 indexes that I track all below QPs. 

From 7/6 close INDA up 6.8% outpacing nearly every other major index / ETF.

Caught nearly the entire bond bounce of 2018

Sometimes I don't know why I am not a full time bond trader as my long term take on this asset class has been remarkable.

Quickly (not going to dig up links for these but if you are curious please search through my site) -

Nailed the top in 2016, one shot
Very vocally bearish in 2016 Q4
Very vocally bearish in 2018 Q1

5/20/2018 Bond bounce
7/7/2018 Bonds down and XLF up

Regarding the recent calls, 5/20 post for bond bounce was the first strongly positive comment about bonds all year - turned out written one day off the low. Then on 7/7 was clearly bearish just just after a key high 7/6.

PS: XLF has done great since that post too. 

Same 7/7 post: "TLT should drop back down. This will alleviate yield curve concern and XLF will get a bounce."

Nailed the June IWM top

6/17/2018 Total market view: "...the combination of crazy momentum on IWM, quarter end re-balancing soon in play, frothy sentiment and the HR2 / YR2 [168.62-169.76] combo make this an ideal area for a decent reversal."

Actual top 6/20 170.20, just one day close fractionally above the upper level. 

6/21/2018 Daily comment: "Serious selling today, but is it one day bear wonder or start of something larger? ... That is quite a lot in the bear column and not much in the bull side. Although Friday could be a sideways day or limited bounce, my conclusion here is that today is not the low and more downside to come." 

1 1 IWM D.png

Bullish comments from 5/3/2018

5/3/2018 Daily comment: "As you can see there are now more +s than -s after this move got started on Monday with 5 clear negatives on the USA mains. The door is open for the bulls to rally back - we'll see what happens."

5/4/2018 Daily comment: "Bulls will want to see SPY join QQQ and IWM above its QP next week, but let's be clear - huge bull win on Friday."

5/6/2018 Total market view: "After massive hold of D200MA, bulls have the ball. I think there is decent chance for a move back to the higher end of recent ranges meaning MayR1 or maybe higher on the leaders."

5/6/2018 Total market view: "SMH back above MP with big hold of D200MA could be worth playing for rally to QP." Note: SMH straight up this week, up ~5% in 4 trading days. 

5/7/2018 Daily comment: "Follow through from Friday's move is positive, but the bulls did not get everything today as the move stopped cold on the SPY QP. That said the move does not look like rejection, other indexes are not on levels, and VIX / VXX not signalling trouble. So at this point I think there is a decent chance that SPY pushes through its QP."

5/8/2018 Daily comment: "SPY stuck under QP. Other than IWM, USA indexes had weak advances. Often such moves are a prelude to selling. But as long as DIA above MP, NYA above HP, VIX below YR1 and VXX not threatening, I give the bulls the benefit of the doubt."

5/9/2018 Daily comment: "Major win for the bulls today with SPY joining QQQ and IWM above all pivots. Only IWM is on a resistance level which means the market should go higher for the next top of significance. In addition, VIX and VXX confirming the move in stocks."


Onto commodities idea from mid January 2018

1/14/2018 Total market view: "The commodity theme could be especially worth watching along with value as a factor; as healthy global economy along with commodities as an asset class near the bottom of returns for most of the decade could combine for a healthy rebound in returns this year."

1/14/2018 Total market view: "Oil getting institutional rotation to start 2018. DXY below all pivots and likely going lower. Also, since commodities have been near the bottom of asset allocation models for many years, think this could be year for significant improvement."

3/4/2018 Blog post: "Some of the smart money sources I trust, especially Jeffrey Gundlach, have been on to commodity idea from the beginning of the year. I recently retweeted something similar from Paul Tudor Jones. Keep in mind I am not simply jumping on bandwagon here as I have been thinking this way too from mid January: "Also, since commodities have been near the bottom of asset allocation models for many years, think this could be year for significant improvement."

USO now 20% YTD leading major asset classes this year, and DBC up a respectable 8.25% vs SPY 2.34%.

USO is one of two major asset class I am tracking to reach YR2. The other being TNX, also no surprise to readers of The Pivotal Perspective, which was loudly bearish bonds (and bullish yield) from the beginning of the year.

And then caught the low

2/9 Tweet From 7:40 am EST: "Best guess for lows on 3 charts w/ 3 methods - $SPX weekly going for 50MA now 2511 and rising; SPX pivots looking like YP area test coming up 2538, may overshoot to FebS3 2522; SPX Fib with 61% busted going to 76% at 2516. ..."

SPX range 2511-2538; actual low 2532. 

Nailed the high

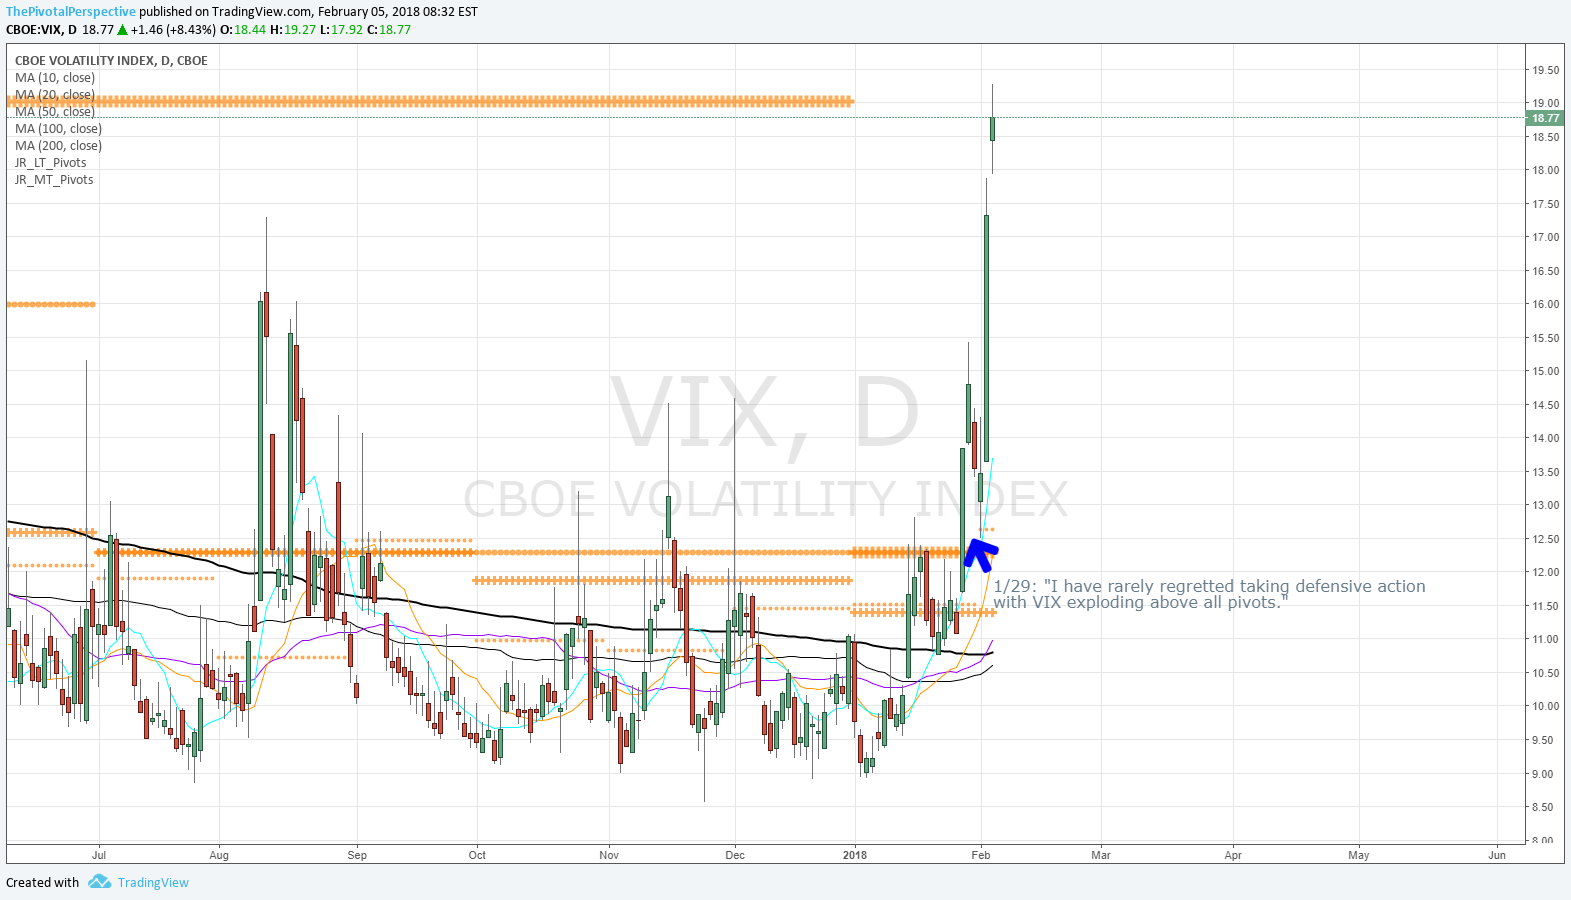
Daily comments made it clear that there was potential for a major turn. I outlined criteria for a partial long exit days in advance on 1/24, and those criteria were met on 1/29. Special timing post on Twitter from 1/24 recommended UVXY as volatility set to spike. 2/1 added to bearish conclusions for next near term move. 

1/23/2018 Daily comment: "There are so many indexes on or near YR1s the situation calls Jan-Feb 2016 to mind, as the only difference was that they were on YS1s. Both years started with a directional bang, reached yearly levels, and then... we shall see. That is our task now, to assess the chances of a turn here." 

1/24/2018 Daily comment (thinking ahead): What to do, especially if VIX is above its Q1P and JanP tomorrow? And then even more so when it lifts above its YP and doesn't look back - something we haven't seen since 8/2015.

  • Take gains on longs that are having clear rejections from resistance levels.
  • Bonds are not working as safe havens this year, so avoid.
  • GLD & GLD are popping on these days especially with $DXY down - watch for these setups or add (site recommended GDX 12/13 then cut mid Jan; GLD from 12/26, still holding personally).
  • UVXY - I've already had one great trade this year and started talking about this yesterday on the site and twitter. I think this will be a favorite setup this year as VIX low is the 2nd trading day of the year and XIV high is not far after on 1/11."

1/24 Tweet from @pivotalmomentum: Special timing post: volatility cycles picking up 1/25-2/2 maybe through 2/15. This does not mean i am saying stocks down from here. There are a lot of YR1s to watch though. Yup back in UVXY already."

1/29/201 Daily commentLong exit recommendation, "Some of the bullish conclusions of Friday were undone today - most especially in VIX. I have rarely regretted taking defensive action with VIX exploding above all pivots. Today met criteria for taking partial profits per Daily comment of last week. (quoted 1/24 notes above) ... All seem like good steps except metals have since looked more toppy. UVXY was up 14% today, and although some of that was a gap there were still large intraday gains."

1/30/2018 Daily comment: "A lot of long term level rejections today, so it was rather pleasant to have taken major defensive action yesterday by significantly reducing longs and adding to UVXY hedge." 

2/1 Tweet: "YR1 rejections brewing on $SPX / $SPY, $NDX / $QQQ, $INDU / $DIA. Weekly charts on continuous futures with yearly levels only on $ES_F, $NQ_F and $YM_F."

2/1/2018 Daily comment: "Stalemate continues with YR1s threatening on 4 of 5 USA main indexes but without serious damage. In particular, YR1s on SPY, QQQ and VTI look like very clear resistance with a weak advance and tag of the level. Usually this means the next move is down. In addition, though XIV held Q1P, clear resistance on the FebP. Combining this with VIX above all pivots adds to bearish conclusion for risk." 

5 2 VIX.png

2018 starting strong as called

12/24/2017 Total market view: "I will change my tune a bit if we see more warning in safe havens but given seasonality thinking 2018 will start with a bang."

12/27/2017 Daily comment: "But I think likely that the first day of 2018 will bring stock buyers."

12/31/2017 Total market view: "I wouldn't be surprised to see risk start off strong in 2018...."

1/2/2018: "While I didn't think January 2018 was going to be a repeat of '17 so far all systems go for stocks."


The China tech call, 10 months later

As we get deeper into 2017 Q4, I am becoming more and more pleased with the call I made about 10 months ago in December 2016:

"...maybe China tech will takeover as a sector-like leader. This is pure theory at this point, since some key China tech names have weaker pivot status than QQQ. Because we should compare apples to apples, let's stick to ETFs instead of stocks. The highest volume is KWEB and it has the big names: Alibaba, Tencent, Baidu, etc. Repeat, not a trade rec, this is larger view idea for a theme we may see in 2017."

Yup! Caveat - portions of the original post were not right because I was also thinking that tech a la QQQ would get laggy at the time. This was when QQQ was still below its 2000 top. After it cleared that level, I changed my mind :)

But really, long China tech was *almost* the best move of the year. The only other thing that I could have said to beat it would have been something like "Everyone thinks Trump will be high volatility, so just put everything into short vol and that will win big." That would have been genious, but I didn't quite get there.

China tech has been the second best trade of 2017 - not too bad. And a lot less drawdown than the -26% shocker in XIV (which I nailed too btw). 

This sort from ETFDB takes out leveraged vehicles; sorted by YTD %.

17 10 ETFDB.PNG

Chart below of KWEB with data of comment "maybe China tech will take over as sector like leader" with QQQ in red, dated from 2016 Q4.

17 11 KWEB vs QQQ.png

Now for the truly dedicated readers - WHY did i make this call? There was not much in charts at the time.

1. Sentiment seemed quite bearish on China, and SHComp already had dropped -49% and was acting more stable. Keep in mind that 2008 was only -57% absolute high to low; so what people were expecting significant downside after -49% already done seemed rather absurd. 

2. I thought given multiples that smart money would start to allocate outside of USA - correct, big time, not just in China tech. It just so happened that China tech benefitted the most from this movement. 

3. Esoteric / proprietary time cycle analysis. Searching timing for more of this aspect of my work. 

A few more charts:

KWEB vs USA main indexes - SPY QQQ DIA IWM VTI.

KWEB vs sectors - XBI SMH XLF XLE
XBI & SMH both having great years too.

18 2 KWEB vs sector.png

KWEB vs other developed, in $USD - EFA EWG EWJ

KWEB vs other emerging - FXI EEM ASHR (ETF for Shanghai Comp) INDA EWZ

18 4 KWEB vs EEMs.png

And now to the short vol XIV, one of the few things to be beat KWEB but with lot more volatlity. 

Bullish comments from 8/21+

8/21/2017 Daily comment: "SPY tested and held AugS1 today, though the bounce for session seemed weak. But factor in moving averages, Bollinger bands and RSI, one has to conclude a 'maybe' low. For SPY, this was the nearest test of D100MA since the election; also, a close back inside the Bollinger band after 2 closes outside; as RSI near lows for 2017. In addition, this is happening as sentiment via standard put-call near highs for the year and CNN Fear & Greed Index at major lows."

9/2/2017 New highs new lows: [8/26/2017] "The market is not 'in the clear' until new highs exceed new lows. Should that happen, point in bulls favor. [9/2/2017] "And that is how it played out on 8/31, with 10MA of new highs jumping to 63 with new lows falling to 49. Note these other crosses since 2016 have been excellent places to return to bullish mode - 3/1/2016 and 11/10/2017."

9/4/2017 Total market view: "As of 9/1 close, all USA main indexes are back above all pivots. This hasn't been the case since 8/1 due to IWM weakness in August. In addition, all global indexes I track are above all pivots as well, and held up quite nicely through August. VIX is back under all pivots. But... TLT and GLD are above all pivots as well, and XIV showed some bearish divergence on 9/1 by not reclaiming all pivots. As of 9/1 close, mostly long risk seemed appropriate, but perhaps not fully long and definitely not leverage with safe havens so concerned about the market."

9/11/2017 Daily comment: "But today, all 5 USA main indexes back above all pivots, and this time XIV confirmed the VIX move by also moving above all pivots (fractionally but still). In addition, monthly charts had seemed to be on the way to reversal bars for the 5 USA main indexes, yet today 4 of 5 (excepting QQQ) went back to positive for the month."

9/17/2017 Total market view: "All 5 USA main indexes back above all pivots on 9/11, and both XIV and VIX together confirmed risk on for the first time since 8/10 on that day as well. Bulls have the ball." "Bottom line - 6 weeks into the seasonal weaker months of August and September, and SPX had a minor dip of -2.95% and raced back to highs. IWM took the brunt of the hit at -7%. I'm going with the trend until price action forces defensive moves the other way...."

9/23/2017 Total market view: "Nearly all stock indexes remain in uptrends, above all pivots. VIX has been below all pivots from 8/22, and XIV above all pivots from 9/11. Safe havens were weaker last week, with TLT breaking its YP and GLD breaking SepP. The environment is bullish for risk assets."

9/28/2017 Daily comment: "In others words, risk on. To emphasize, SPX very bullish above 2503 because it opens the door to 2576."

9/29/2017 Daily comment: "Market closing out Q3 strong with convincing breakout above long term resistance for SPY. This is important as above 2HR1 opens the door to YR2 up near 258 on SPY and 2576 on SPX." 

10/1/2017 Total market view: "Bottom line - SPY and VTI just broke out above long term resistance as TLT fell back under its YP and GLD continued to fail from its breakout attempt. In addition, weekly charts on many global indexes look similar to USA indexes in August -  in other words, a normal pullback in an uptrend. Stock bulls have the ball."

10/2/2017 Daily comment: "USA main indexes continue to power up, with all 5 above all pivots and above all MAs... Also, none of these are currently at any pivot resistance levels as IWM rallied above its 2HR1 today. Next levels up for most others are OctR1s, and then more important Q4R1s above that. Safe havens are all saying bullish for risk assets...."

10/3/2017 Daily comment: "More points in the bulls favor with all USA indexes continuing up, VIX & XIV failing to reverse despite the chance to do so, and both EEM & EWZ joining the "above all pivots" party in a massive way. Oh yeah, FXI and EWZ both +3%." "In other words while extended, the ideal top is higher than now."

6 2 SPY D.png

GLD & GDX exit!

I saw GLD holding its YP in July and thought it could be a worth a shot. That was 7/11. From there held through a few pullbacks and was excited at the blast off. But I don't mess with yearly rejections in an asset that is not really trending up on larger timeframe charts.

9/11 Daily comment: "GLD fell back under YR1, and GDX under 2HR1. Exits are trickier than entries. I don't like long term level rejections though sometimes after a brief drop the market comes back. This is why I also factor in higher timeframe charts and other technicals. One could be trimming both based on the move today; or give more room by holding a portion above all pivots and/or above rising moving average (for example, holding until 2 consecutive closes below a 10MA). Based on the weekly charts I'd say err on the side of taking gains with any additional weakness below GLD YR1." (bold added)

9/16 Safe havens: "Sum: GLD falling back inside weekly BB and under YR1, but still above all pivots and all rising MAs could try to come back. Since 2011 high, overshoots of weekly BBs have been rare and most have been near key trading highs. Exits trickier than entries, but given YR1 rejection, weekly Bollinger band, Q3R2 level also in play, i erred on side of taking nice profits from the 7/11 buy. If following system of 2 bars under 10MA, then also out. Rising 20MA and Chandelier are still in the trade, and above all pivots also still in trade - case to be made for holding half. Monthly chart look to me settles any question - exit was the right decision with resistance at 2016 monthly close high and 100MA."

GLD and GDX!

TPP recommended a decently sized position in GLD on 7/11. At the time I was maintaining a public Pivotal Portfolio, and it was for 2 units on top of being 100 long at 10 units, for 120% exposure with leverage. So if you want call this 15-20% is up to you.

Then on 8/23, I wrote a special mid week post on the blog pointing out that GDX had joined GLD above all pivots, and even SLV was starting to perk up.

9 71 GDX D.png

And here's the percentage gain from 8/23 that move on, still 8.5%.

About my timing project...

With no indication of direction, August turn dates were posted 7/23/2017.

8/2
8/8
8/11
8/16
8/21
8/25
8/30

And here's how it played out on SPY.

8/2 - mild pullback low
8/8 - high for the month
8/11 - near low made on 8/10 (and ES futures low 8/11)
8/16 - bounce high
8/21 - low of month
8/25 - mild high
8/30 - non event

So if you are willing to think that I wouldn't possibly make this sort of thing up, and know that I was a strategist at a fund that was one of the top in the world in 2013 achieving 110% gain before it closed down, perhaps you would be willing to accept my statements that:

Direction is sometimes possible, but takes a lot more time to track and research.

This system is an extremely complex and nuanced, involving layers of data and judgment; it is not algorithmic and not programmable (at least to my satisfaction), and hence out of fashion. 

Timing work has been quietly in the background on some big calls like the 2016 bond turn, 2017 VIX low/XIV high, etc. 

I believe this post and others have proven that I've got something going on in this regard, and should an open minded fund be interested in this very unique strategy, please contact me. 

Cautious and defensive from 7/23/2017

7/23/2017 Total market view: "A lot has changed from my confidently bullish assessment of last week. First, all USA main indexes have reached medium term resistance (ie, Q3 or July pivot resistance levels). Safe havens have strengthened. Sentiment readings are considerably more bullish. Thus, some reaction lower for stocks is a much greater possibility."

7/30/2017 Total market view: "So although larger trends intact, I thought higher odds of reaction lower in stocks. So far the market has been resilient and first drop on 7/27 was bought. I think the market is inviting sellers so we'll see if they show up."

8/6/2017 Total market view: "Bottom line - Larger trends for stocks intact. But with safe havens strengthening, VIX divergence and XIV bang on YR3 it is time to pay attention to risk management."

8/13/2017 Total market view: "But is this another index mini-dip / false break / one day bear wonder like 4/13/2017 or 5/17/2017, each days that looked to be risk-off yet turned out buying opportunities instead? I don't think so - risk-off seems real this time."

Markets agreed with these assessments, as only DIA went higher in August before a broad decline, and all USA main indexes formed a key low (so far) on 8/21.  

This defensive stance was coming after turning confidently bullish early in July.

7/9/2017 Total market view: "Basically with VIX dropping from 2HP / Q3P, yearly levels threatening break yet recovering, pivot holds or recoveries on SPY, QQQ, DIA, IWM, VTI, VIX and XIV all (!) on 7/7, I'm going with idea of near term bullish resolution."