Sum
The last few weeks I've been very clear - as SPX just held major support I thought it would make a run to major resistance and so I've been pointing to 2820-30 (QR1 actually 2822) since. Last week reached 2816. Was that it?
Similarly, NDX not quite at target area QR1 HR1 YR2, but still could power up to test those levels. RUT testing YR2 for the 3rd time this year and so far with the least damage.
Bullish scenario will be SPX and NDX up to target areas with RUT above YR2. This will be more likely to play out if above WPs next week.
DJI and NYA comparatively weaker as they have been for much of the year. DJI could be first choice as main index hedge as it has had resistance at JulR1 and if lower will be first to have any pivot break. NYA reflecting global weakness but not a trading vehicle.
Bottom line still pulling for indexes to reach target areas, but if any signs of weakness may take some off table and/or add hedges on DIA.
SPX SPY ES
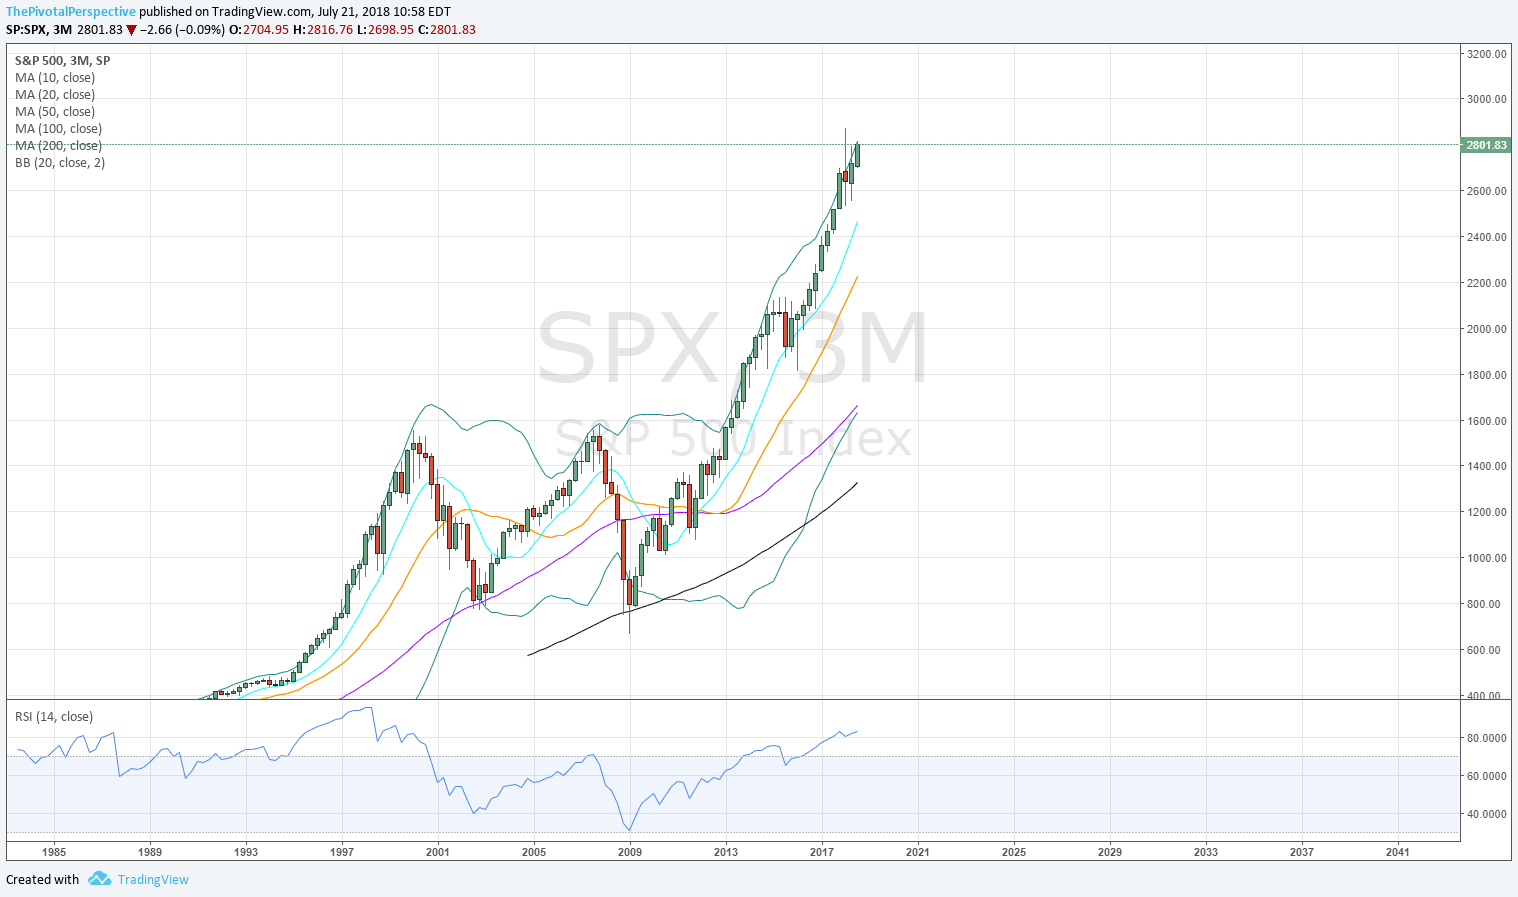
SPX Q: High on BB exact to the point so far.
SPX W: YR1 near test.
SPY D: YR1 & QR1 nearly same level for the ETF.
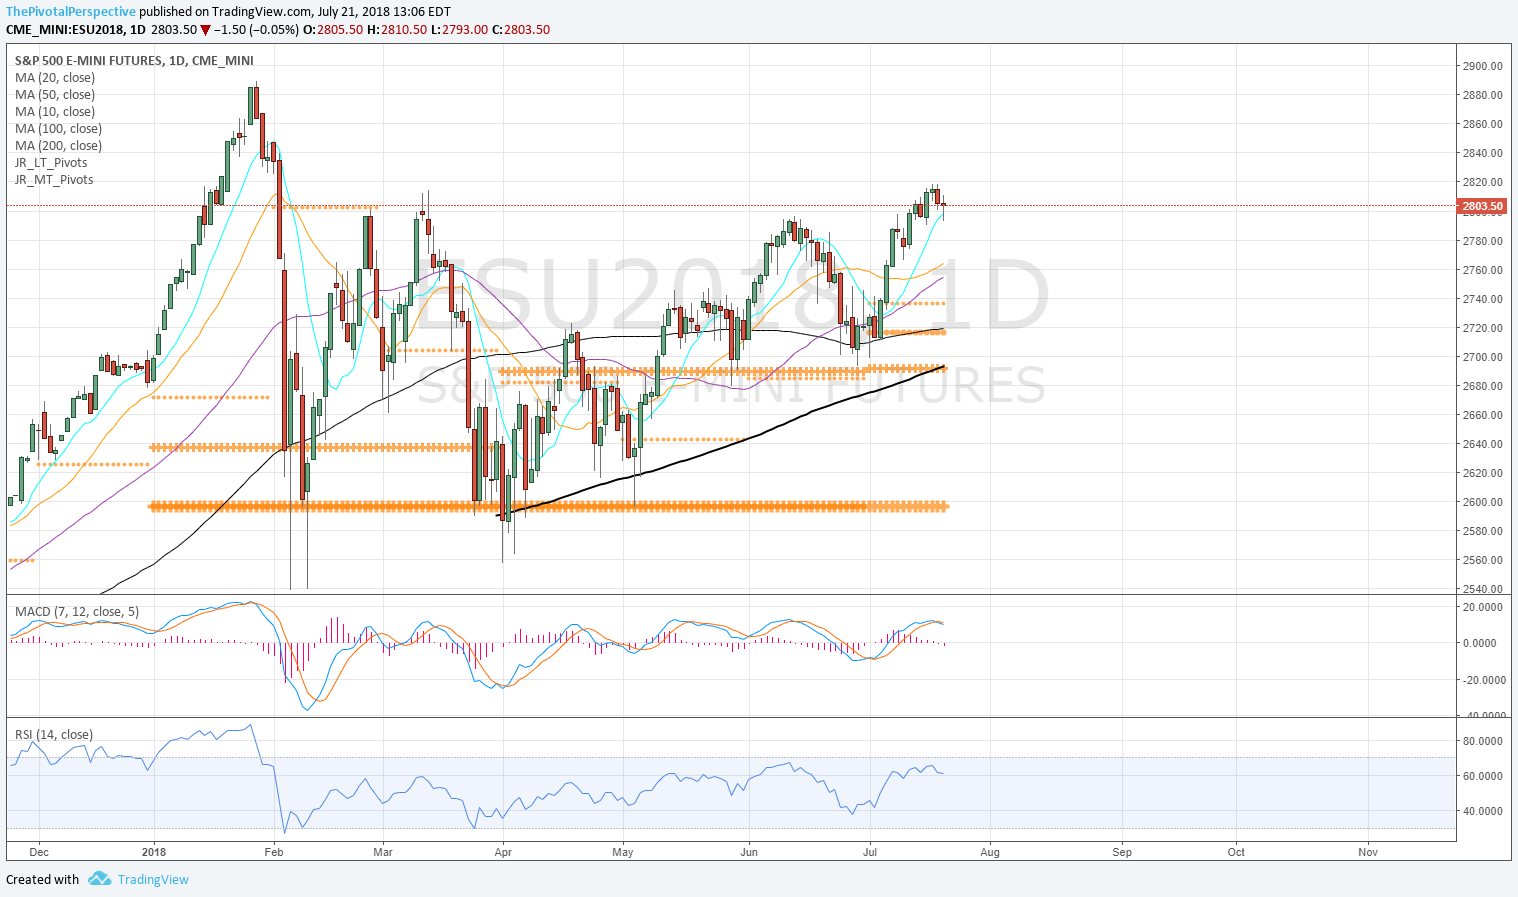
ES D: Last 2 days just a pullback to nicely rising 10MA.
SPY 2H: All above weekly pivots since 7/5, with the WP perfect buy last week.
SPX sum: Pulling for SPX to reach QR1 - YR1 target at 2822-2830, but the question is whether 2816 was close enough. Q BB at 2816 exact adding to resistance in this area. Near term tells are the response from the daily 10MA and next weekly pivot.
NDX QQQ
NDX Q: Q RSI 89.98 - pro selling at 90 area possible.
NDX W: Healthy lift above YR1 in the 2H so far - enough juice to reach HR1 near 7500?
QQQ D: Resistance cluster QR1, HR1 and YR2 182-184.
QQQ 2H: All above WP from 7/5; dip below last week quickly recovered.
NDX sum: Still expecting this to reach QR1 HR1 YR2 area 7460-7570 on NDX and 182-184 on NDX sum. Tech has been amazing but people who think it is going up forever with Q RSI at 90 area are delirious.
DJI DIA
DJI W: Recovered above HP the 2nd week of the new half.
DIA D: 3 of last 4 days resistance at JulR1. If above that QR1 likely strong resistance.
DJI sum: Weakest main index; below JulR1 can consider short hedge; if down will be first to have any long term weakness.
RUT IWM
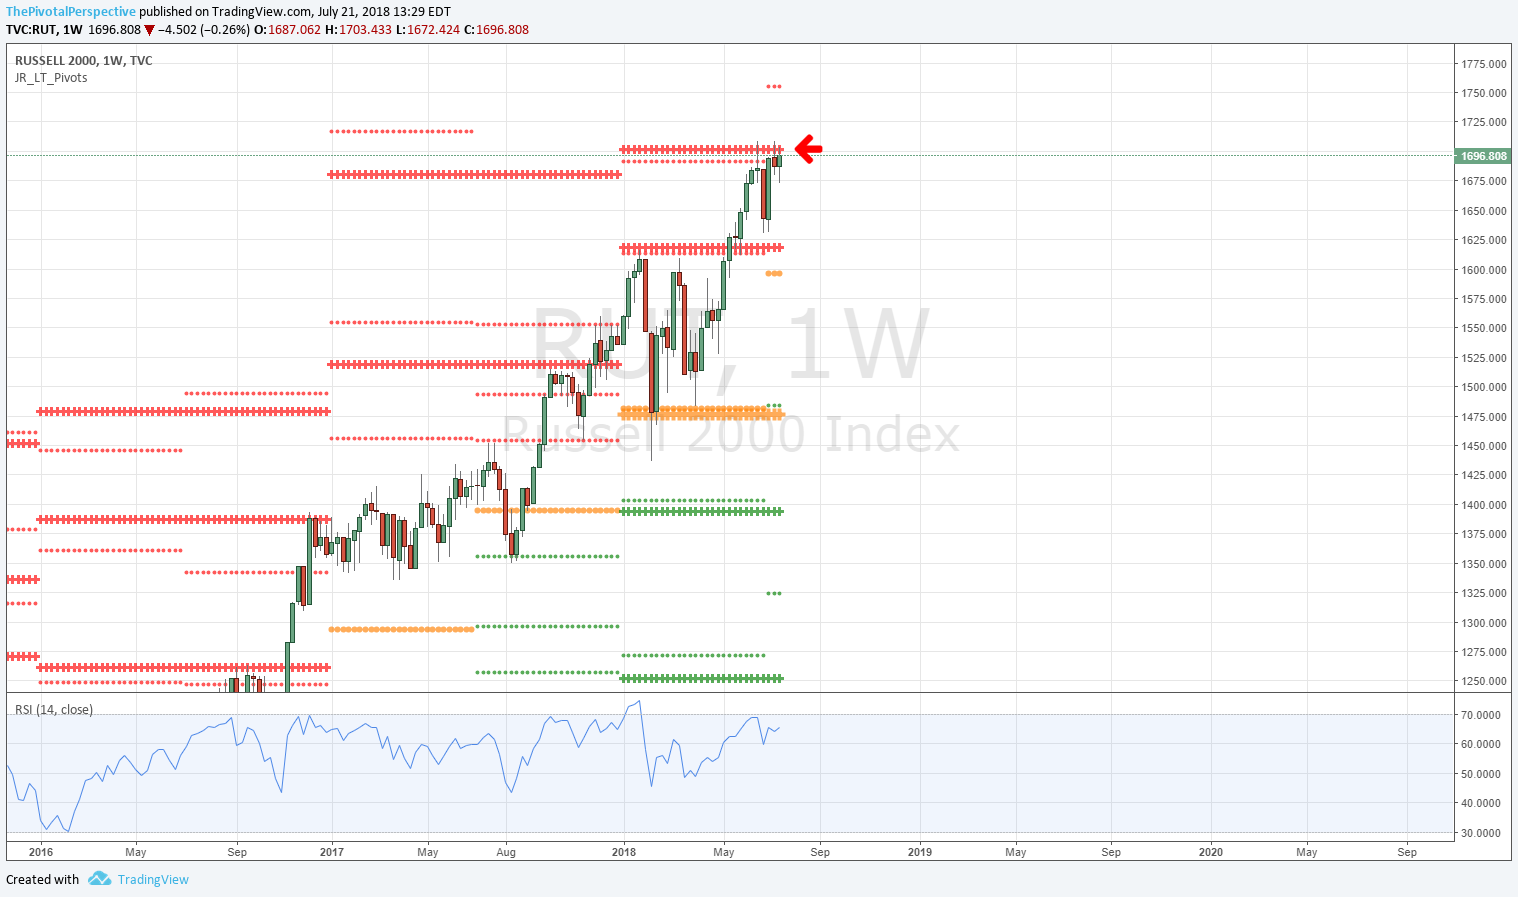
RUT W: Testing YR2 4 of last 5 weekly bars. Last week seemed to give chance to clear but still under the level.
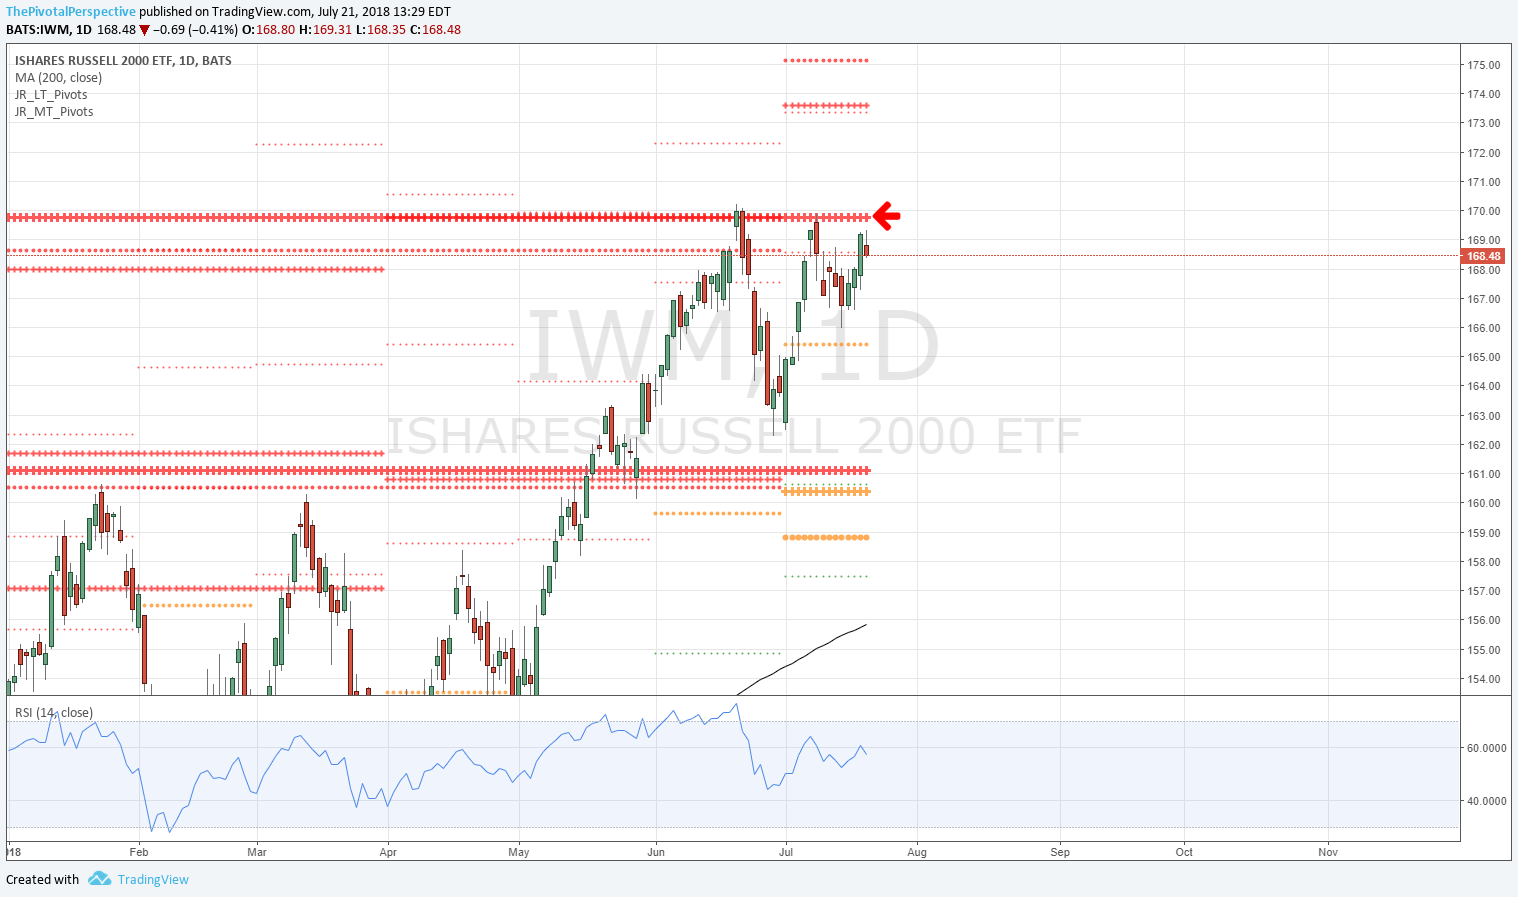
IWM D: 3rd time up to YR2 with minimal damage so far.
RUT sum: Back to YR2 for the 3rd time in recent weeks. Will it clear? Not sure, but next week I'll be using the WP as additional clue of whether next move is breakout up or rejection.
NYA
W: Above the HP but does not look convincing.
D: Also resistance at JulR1 with HP just below.
NYA sum: Looks vulnerable to drop, but have to give bulls benefit of doubt above HP and D200MA.


