Sum
Long term trends as measured by YPs and HPs are positive for the USA main indexes. These levels were tested in February and again in late March / early April and have held. However, last week indexes tried to turn medium term trends back to positive and failed. Next move seems up for grabs and there are a lot of levels that will make the decision easy:
SPY just below QP / MP combo; bearish below, more bullish above
DIA testing MP; more bearish below
QQQ testing QP; more bearish below, bullish if rebound
IWM probably needs to hold above all pivots for the bullish case
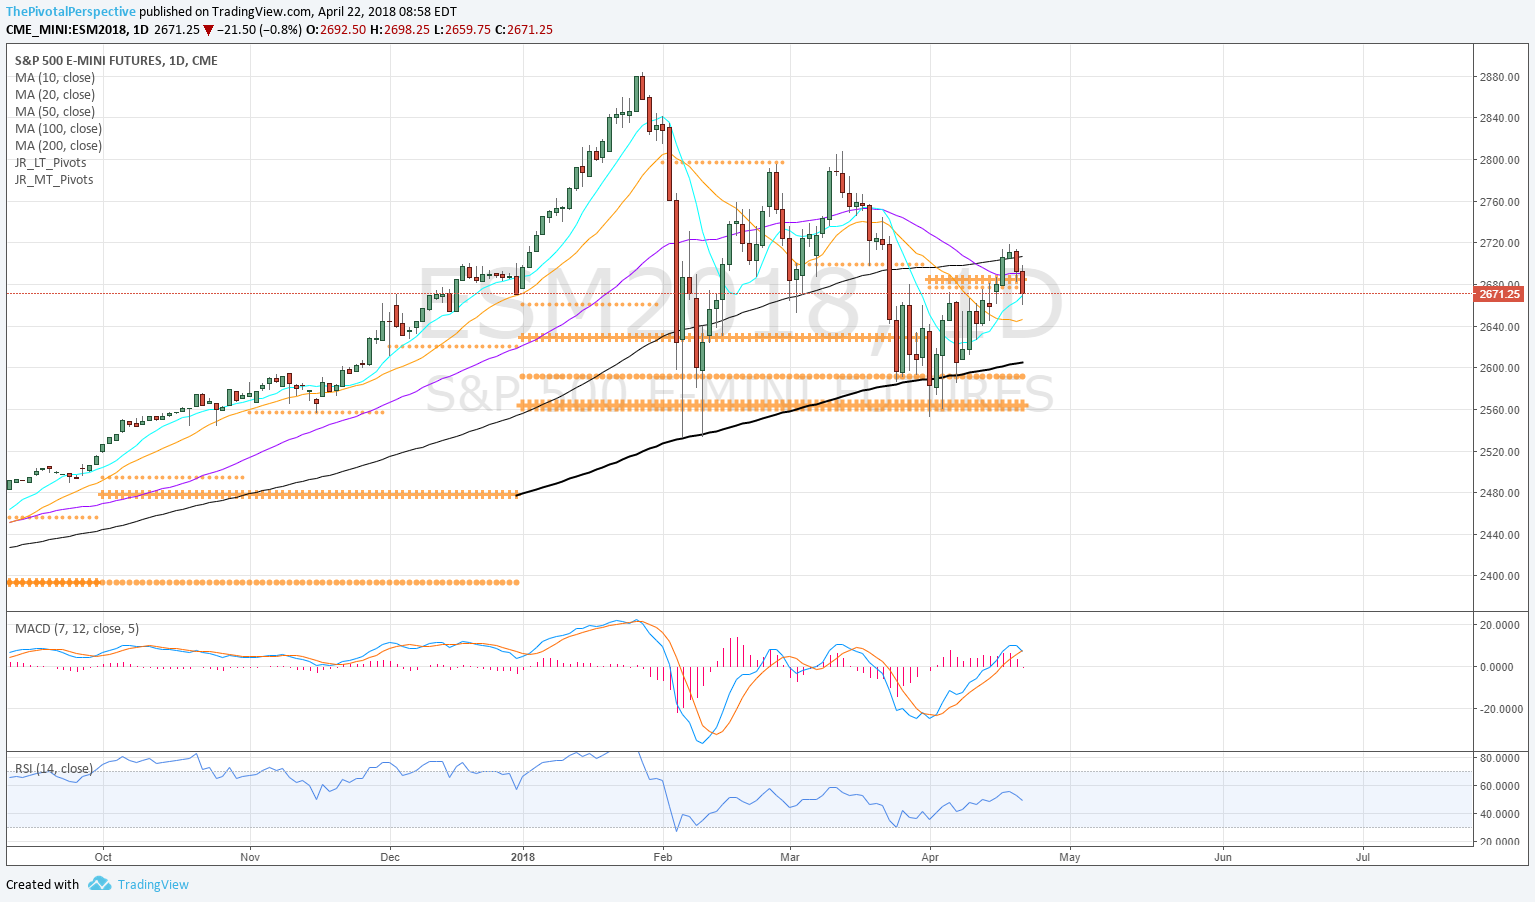
SPX / SPY / ES
SPX W: High of year on HR2, lows of year on YP and HP. Now mid range.
SPY D: 3 days above QP and MP only to fail on Friday. Red line is 2017 close which is also important level in play functioning like a pivot.
ES D: More bearish below the QP MP combo, but could try again to recover.
SPX sum: Range bound action for 2018. Near term Q2P decides whether odds favor high test with potential for more or low test with potential for breakdown.
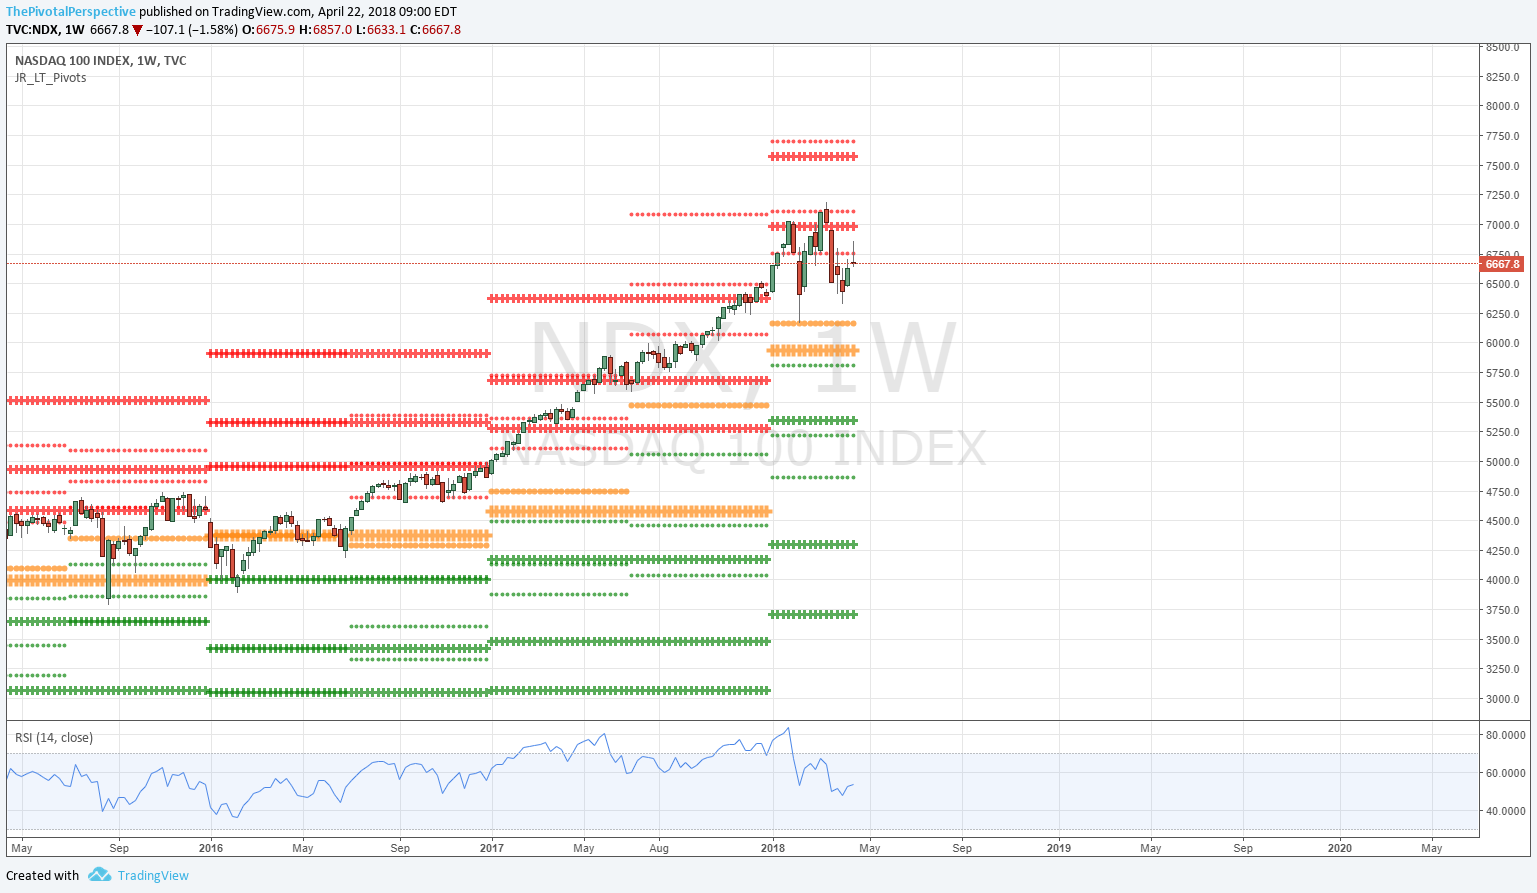
NDX / QQQ
NDX W: High on HR2, low of HP.
QQQ D: Testing QP.
INDU / DIA
W: High on YR1, lows on HP
D: 2 days above QP then slight break then fail. Still above MP though.
RUT / IWM
RUT W: Also range bound between HR1 high and YP near low.
IWM D: Currently above all pivots is definite point on the bull side.
NYA
NYA W: Tested and held YP area 4 weekly bars. But bounce doesn't look too zippy.
NYA D: QP rejection; above MP, HP and YP.


