Alibaba has been an amazing stock in 2017. I was thinking about China tech in December 2016 and though one part of the reasoning was not correct, the conclusion was: "maybe China tech will takeover as a sector-like leader."
Anyway, I thought it would be helpful in conjunction with the last post and also while thinking about exit system (GLD this week) to consider a few views of this chart.
BABA M
Breakout above monthly close high 4/2017. At the time I would have thought that fairly late. 4 consecutive bars outside the monthly BB from 5/2017 on and now working on #5.
BABA W
RSI is literally off the chart and I had to adjust the view just to see it up there. OK maybe some minor divergence but not really any of the threatening sort. If this dropped into 60-70 i'll bet smart money would be scooping that up.
BABA D
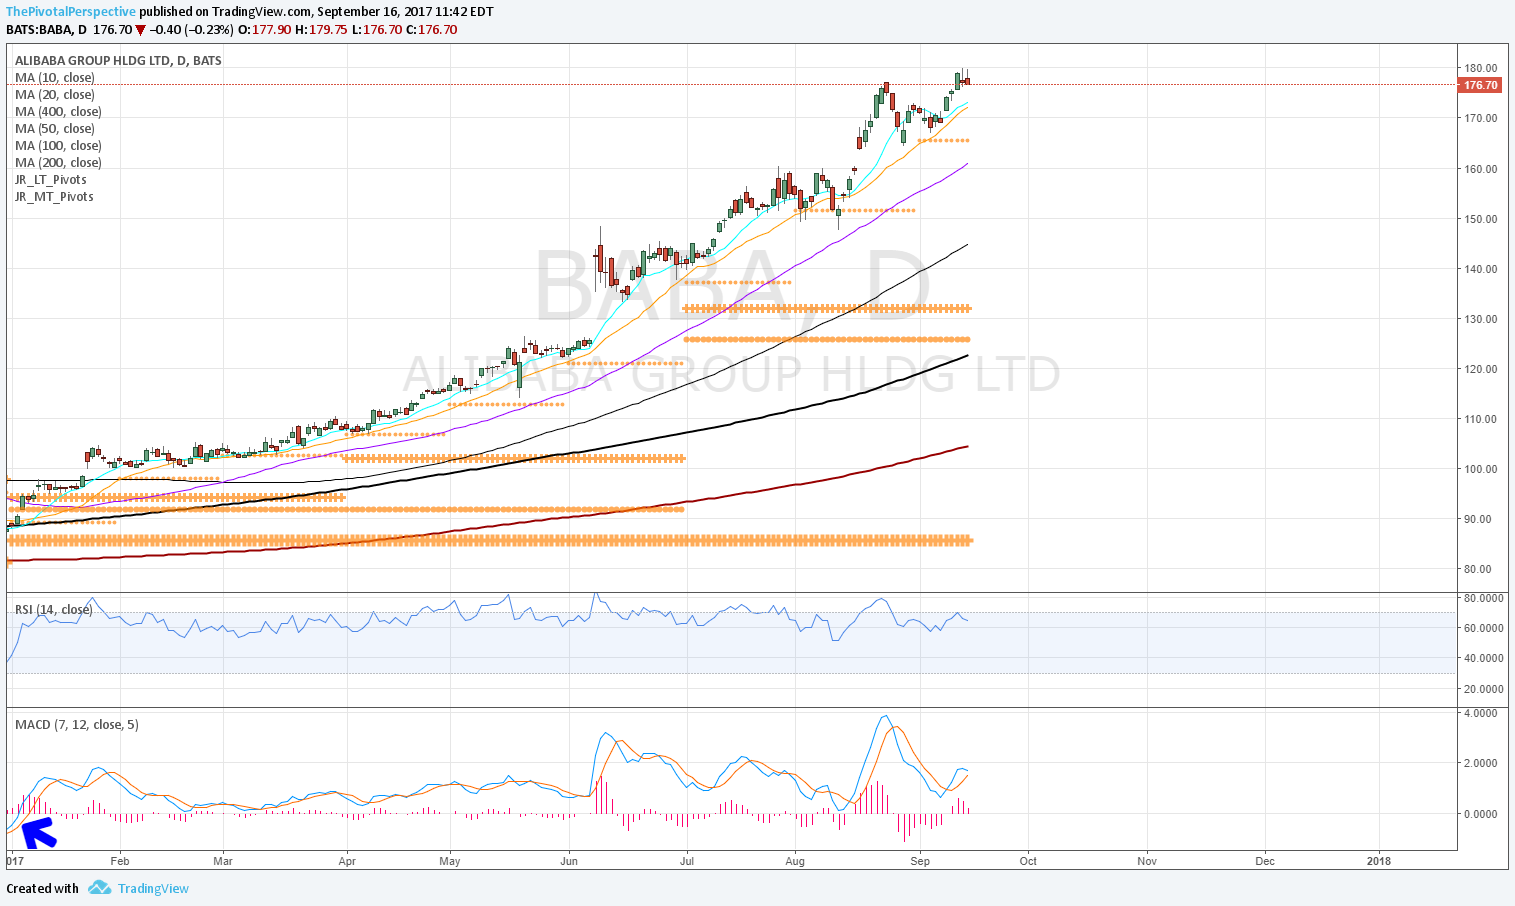
Above all pivots from 1/10 on; 8/11 came back to close above. Daily MACD turned up early in the year and hasn't turned negative since! Only 2 days below the D20MA since 3/8.
BABA D
Even the strongest trend will have resistance level rejections from time to time. These are Y and H resistance only in red, with selling days from these levels or near tags marked in arrows.
KWEB D
This idea even more clearly shown by KWEB, which is up a very respectable 66% YTD. Selling at these levels without getting back in would have cost additional gains!
BABA D
Back to BABA and the moving averages only without price - 10 in aqua, 20 orange, 50 purple, 100 thin black, 200 thick black, and 400 thick brown. It is that kind of slope, especially on D20 and D50, that gets benefit of doubt.


