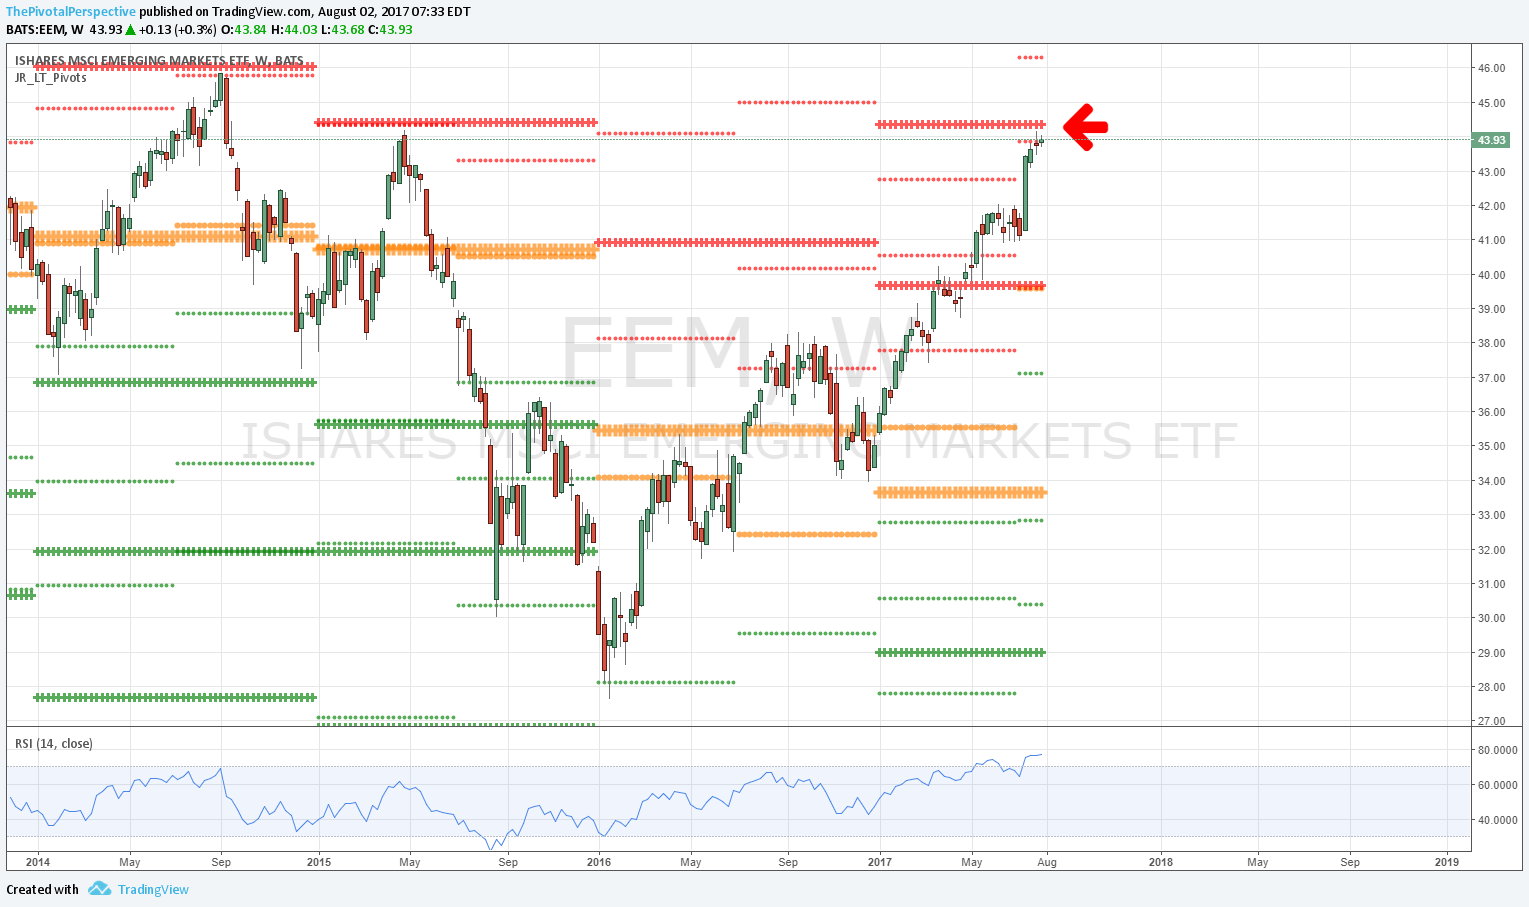
Some long term levels to consider.
Yes I like the China, India and EEM trade and TPP rotated into this in March with a substantial percentage of portfolio since then, often 40%. This has benefitted from Trump shenanigans and institutional recognition that EEMs should have far higher market cap compared to global GDP and GDP growth. But if markets were to have a pause, it is at places like this.
That said, all these weekly charts have RSI strength with higher highs than May. This increases the chance of mild drop and/or eventual comeback.
EEM W
YR2 area and 2HR1 testing, pullback likely.
INDA W
So far soaring above, bullish. Easier to hold above the YR2 as support.
Hang Seng Index W
Bang on YR2 here.
NIFTY W
YR2 and 2HR1 tag - so far not above.
SENSEX
Same move - YR2 and 2HR1 tag.
MSCI Emerging Market Index Futures Cont Contract
YR2 and 2HR1 combo too.


